
Figures & data
Figure 1. Independence values of students X and Y. Note: The left-side radar plot reports the similarity values calculated between professor A’s five articles published between 2004 (t−3) and 2008 (t+1) and student X’s thesis defended in 2007 (t). Articles are ordered clockwise by publication date and are labeled with an id with the following format “p.publication year.article two-digit identifier”. The arrows indicate the value of student X’s Independence (0.152) from her supervisor, which is calculated as 1-max(sim). The right-side radar plot reports the similarity values calculated between professor A’s articles published between 2002 (t−3) and 2006 (t+1) and student Y’s thesis defended in 2005 (t). Articles are ordered clockwise by publication date. The arrows indicate the value of student Y’s Independence (0.058) from her supervisor, which is calculated as 1-max(sim).
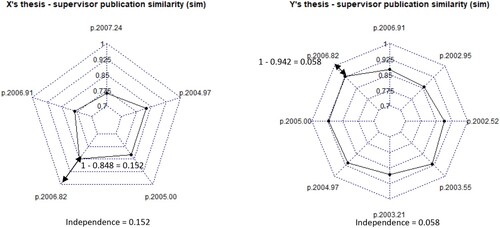
Figure 2. Standardized Independence score distribution. Note: The two figures report the Kernel density estimation of the Independence distribution by defense cohort (left panel) and thesis discipline (right panel). Values of Independence reported in the panels are standardized and range from −2 standard deviations to 6 standard deviations.
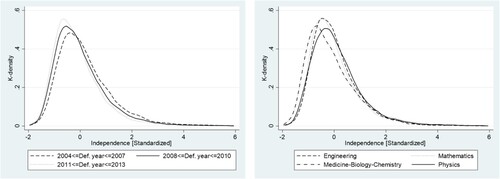
Table 1. Descriptive statistics for the variable Independence.
Table 2. Descriptive statistics for dependent and independent variables.
Table 3. Regression explaining Independence.
Figure 3. Predicted probability of starting an academic career vs. Independence, including the Independence squared term in the regression. Note: The figure represents the predicted probability of starting an academic career for an average student. We define an average student as a student having all the control variables included in the econometric model reported in Column 3 of at their average value.
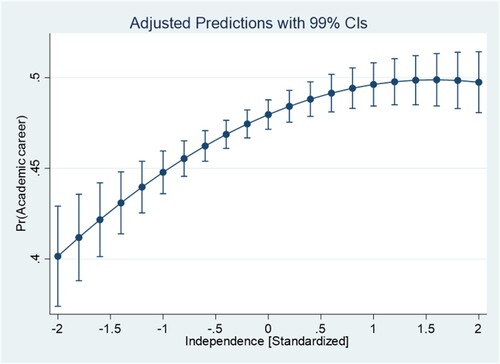
Table 4. Regression estimating the relationship between independence and the probability of starting an academic career.
Table 5. Regression estimating the relationship between Independence and academic career outcomes.