Figures & data
Figure 1. Antimicrobial resistance of 286 APEC isolates collected from clinical cases between 2014 and 2018. The isolates showed the highest resistance against nalidixic acid (98.0%), followed by ampicillin (71.7%), tetracycline (69.9%), sulfisoxazole (61.2%), enrofloxacin (60.1%), and ciprofloxacin (54.9%). Abbreviations: ampicillin, AMP; amoxicillin-clavulanic acid, AMC; cephalothin, CEF; cefoxitin, FOX; ceftiofur, XNL; cefepime, FEP; apramycin, APR; gentamicin, GEN; streptomycin, STR; neomycin, NEO; tetracycline, TET; nalidixic acid, NAL; enrofloxacin, ENR; ciprofloxacin, CIP; trimethoprim-sulphamethoxazole, SXT; sulfisoxazole, FIS; chloramphenicol, CHL; florfenicol, FFC.
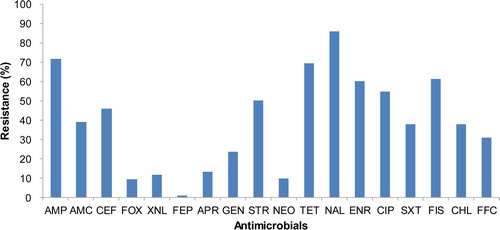
Table 1. The MIC distribution of quinolones against 132 isolates of fluoroquinolone-resistant APEC.
Table 2. Mutations in gyrA, parC, and parE of 132 isolates of fluoroquinolone-resistant APEC.
Table 3. The distribution of quinolone MICs and mutations in gyrA, parC, and parE of nine APEC isolates harbouring the PMQR gene qnrS1.
Table 4. Antimicrobial resistance patterns and virulence-associated gene contents of representative fluoroquinolone-resistant isolates of APEC used in biofilm formation and intramacrophage survival assays.
Figure 2. Biofilm formation of fluoroquinolone-resistant and pansusceptible isolates of APEC. Each isolate was tested by a crystal violet assay using polystyrene microtitre plates with LB broth. Bars show averaged biofilm levels from two independent experiments and error bars represent standard errors. Although isolates of mutant groups C and F formed relatively robust biofilms 24 h post-incubation compared with the pansusceptible isolate (*P < 0.05), overall, their biofilm levels were low, and there was no significant difference between fluoroquinolone-resistant and pansusceptible isolates.
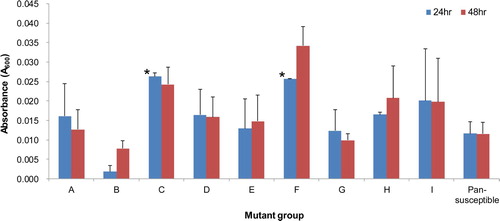
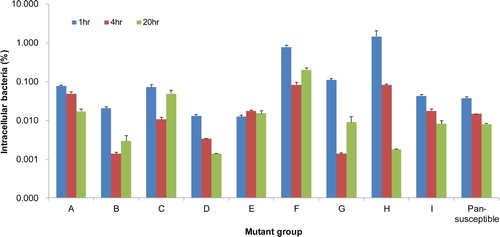
Figure 3. Intramacrophage survival of fluoroquinolone-resistant and pansusceptible isolates of APEC in the chicken macrophage cell line HD11. Bars represent the ratio (%) of intracellular bacteria to inoculated bacteria that was determined based on three independent experiments, and error bars indicate standard errors. The isolates were able to survive in the HD11 cells with variation, but there was no significant difference in intracellular survival between fluoroquinolone-resistant and pansusceptible isolates.