Figures & data
Table 1. Design of the experiment.
Table 2. Table of antibodies and antibody combinations used to determine immune cell populations of chickens by flow cytometry.
Figure 1. Shedding of S. Infantis in four different chicken breeds (directly infected and in-contact birds). Shedding profile of Hubbard birds was significantly different (P < 0.05) from the three other breeds.
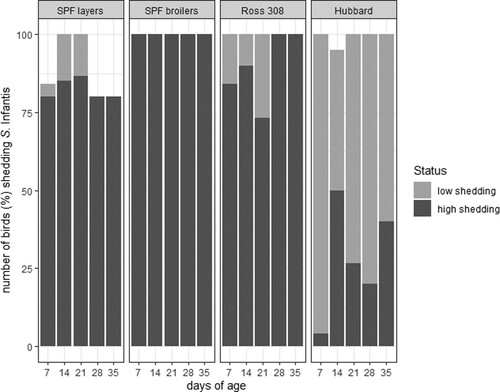
Figure 2. Shedding of S. Infantis in four different chicken lines separating directly infected (n = 15 birds per line) from in-contact birds (n = 10 bird per line).
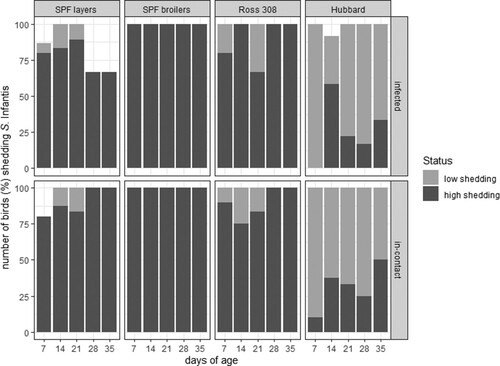
Figure 3. Colonization of S. Infantis in caecum, liver and spleen of birds from four different breeds detected by enrichment or direct plating.
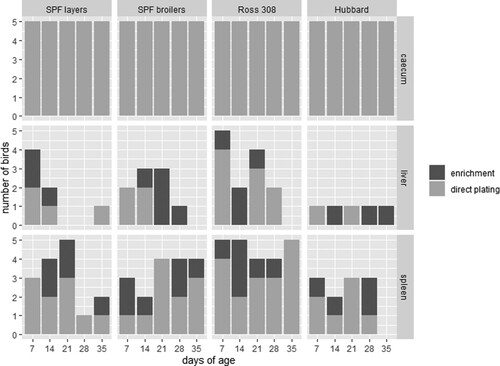
Figure 4. Comparison of the colonization of S. Infantis in caecum (a), liver (b) and spleen (c) between four different chicken lines (n = 5 birds per line and per killing day). Logarithmic transformation of CFU counts were used. Significant differences between the two groups are marked with **P < 0.01 or ***P < 0.001.

Figure 5. S. Infantis ELISA results (logarithmic transformation of mean OD values) of four different lines comparing infected (directly infected and in-contact birds) against negative birds (n = 25 birds on the first sampling day per breed with reduction of five birds per day). Significant differences between the two groups are marked with **P < 0.01.
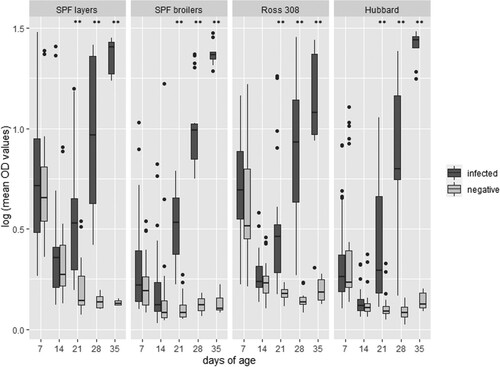
Figure 6. Absolute cell counts in logarithmic transformation of six immune cell populations in four different lines, infected and controls, at five sampling days (n = 3 birds per group per sampling day). Significant differences between infected and negative birds are marked with *P < 0.05 or **P < 0.01.
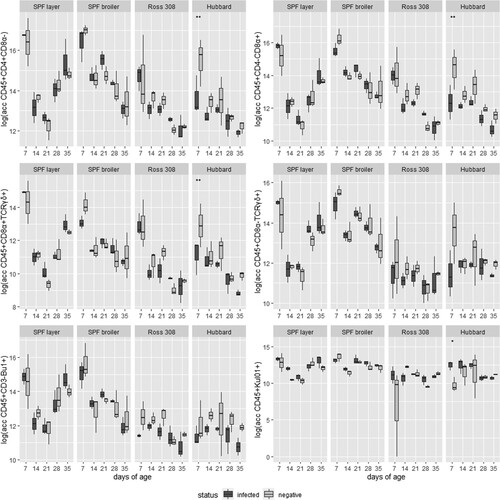
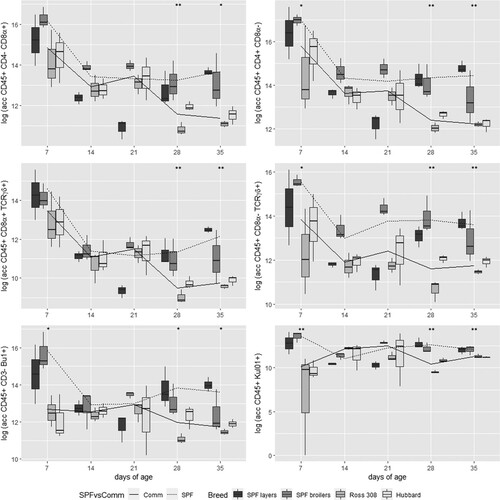
Figure 7. Comparison of absolute cell counts in logarithmic transformation of six different immune cell populations at five sampling days between four different lines represented in boxplots and between combined data of SPF lines (including results of SPF layers and SPF broilers) and commercial (Comm) lines (including results of Ross 308 and Hubbard) in lines. Significant differences between the two combined groups (SPF and Comm) are indicated with *P < 0.05 or **P < 0.01.