
Figures & data
Figure 1. Model overview.
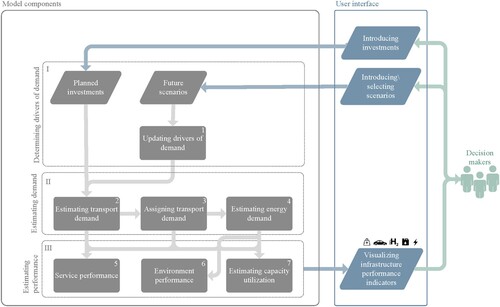
Table 1. Model indicators.
Table 2. Elasticity values of the determinants of road passenger demand.
Table 3. Elasticity values of the determinants of railway transport demand.
Table 4. wL multipliers for each load factor.
Table 5. Elasticity values of the determinants of freight transport demand.
Table 6. Lock transit time based on lock I/C.
Figure 2. Case study region.
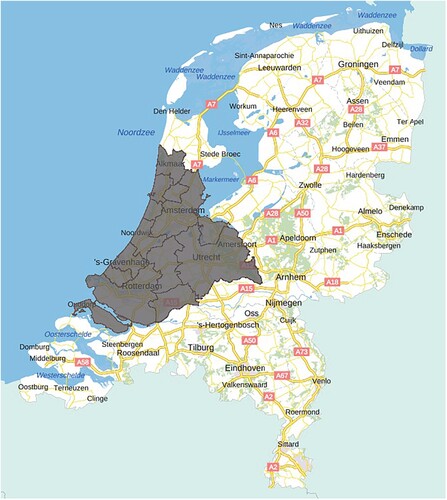
Figure 3. Transport networks and zones. (a) Passenger. (b) Freight.
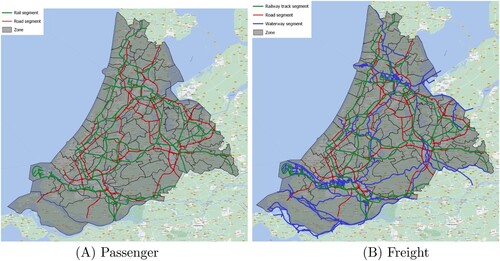
Table 7. Scenario description.
Table 8. Emission, energy, and transport demand input variables for each future scenario.
Table 9. Freight transport fleet and emission factors at the base year.
Table 10. Passenger transport fleet and emission factors at the base year.
Figure 4. Passenger demand changes. (a) Road. (b) Railway.
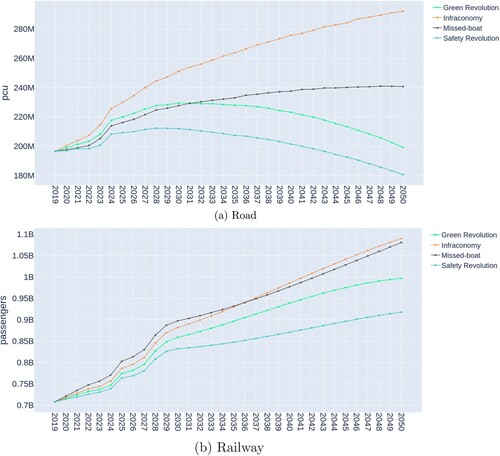
Figure 5. Railway network passenger demand in 2050 and performance development. (a) Base year demand. (b) Infraconomy demand. (c) Green revolution demand. (d) Missed-boat demand. (e) Safety revolution demand. (f) Railway GJT.
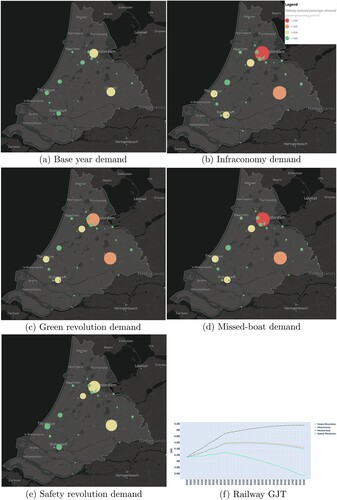
Figure 6. Freight demand changes. (a) Railway. (b) Road. (c) Waterway.
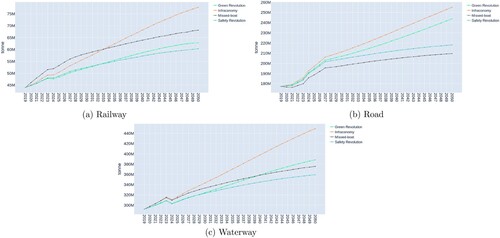
Figure 7. Environmental performance changes. (a) Railway CO emission. (b) Road CO
emission. (c) Waterway CO
emission. (d) Railway energy consumption. (e) Road energy consumption. (f) Waterway energy consumption.
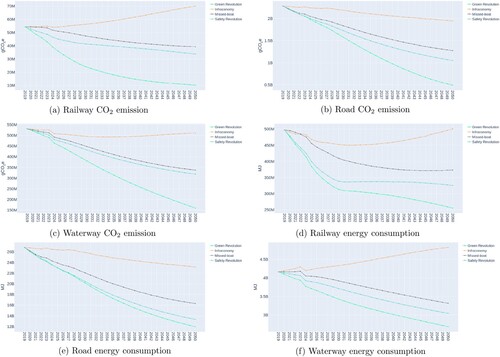
Figure 8. Freight I/C of railway segments in 2050. (a) Base year. (b) Infraconomy. (c) Green revolution. (d) Missed-boat. (e) Safety revolution.
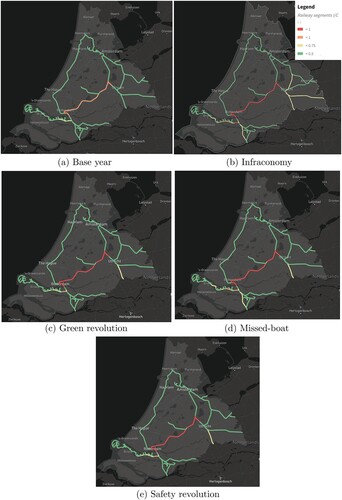
Figure 9. Road network delay factor in 2050. (a) Base year. (b) Infraconomy. (c) Green revolution. (d) Missed-boat. (e) Safety revolution.
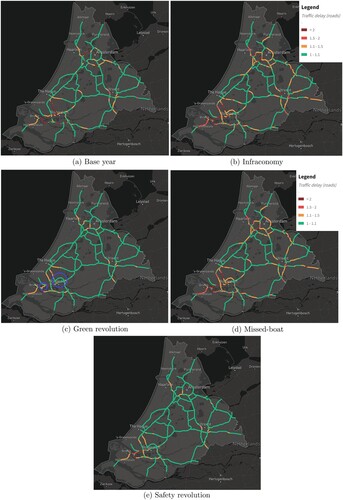
Figure 10. Waterway network intensity-capacity ratio in 2050. (a) Base year. (b) Infraconomy. (c) Green revolution. (d) Missed-boat. (e) Safety revolution.
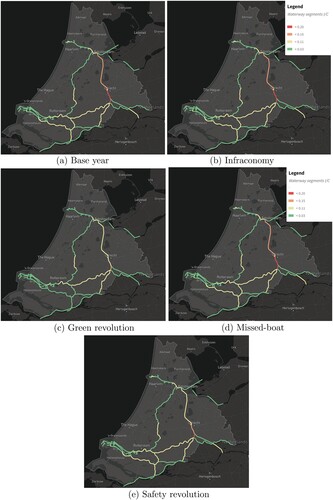
Table 11. Lock I/C ratios in 2050.
Table 12. Results' comparison with national models.
Data availability statement
Derived data supporting the findings of this study are available from the corresponding author on request.