
Figures & data
Figure 1. (a) Development of 3D Model of all the bones from CT scan data, (b) CAD model of the ankle prosthesis, (c) Virtual operation, implant positioning of the prosthetic ankle joint.
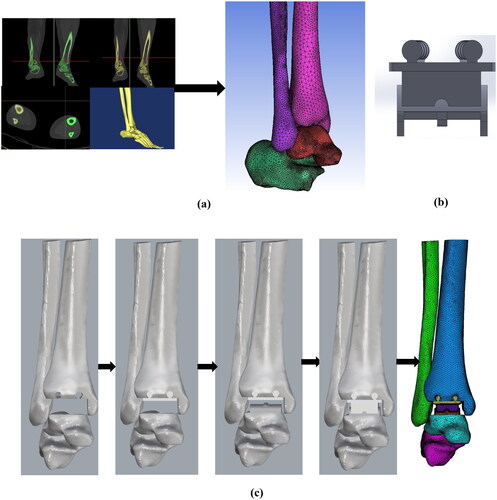
Figure 2. FE model of implanted ankle joint shows different ligamental boundary conditions.
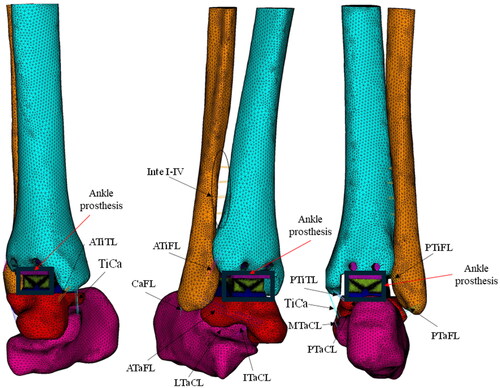
Table 1. Material properties of bones, cartilage, ligaments and prosthetic components [Citation24, Citation26, Citation29–34].
Table 2. Magnitude of reaction forces corresponding to dorsiflexion positions of ankle as per the present coordinate system [Citation24, Citation26, Citation30, Citation35].
Figure 3. von Mises stress and strain distribution at the talus bone after the immediate post-operative and bone remodelling condition.
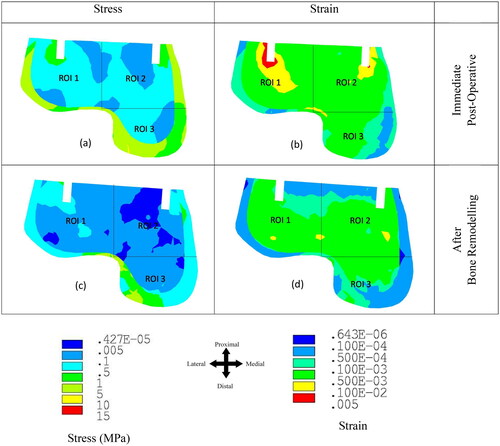
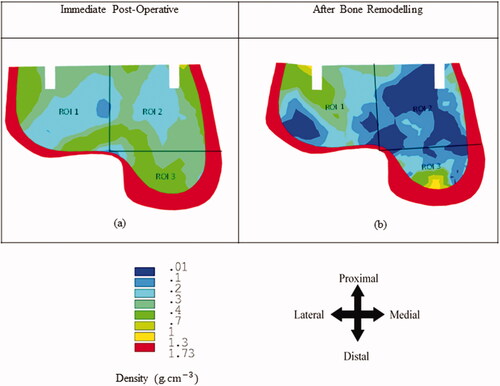
Figure 4. Bone density distribution at the talus bone after the immediate post-operative and bone remodelling condition.
Data availability
The authors will provide the raw data used to support the results in this article upon reasonable request.