
Figures & data
Figure 1. Flowchart of the Geoportti self-assessment Tool from the users’ perspective. 1Nine questions for the UEF geoinformatics advanced course (“Advanced”).
Figure 2. The spider graph results from the Geoportti self-assessment Tool for three exemplary students in the “geoinformatics advanced course” (UEF 2019) show the change in their self-assessed knowledge and understanding in nine subject topics during the course. Acronyms T1–9 refer to the nine subject topics of the self-assessment (). For example, the scores of student 1 had generally increased, except for subject topic T9 that had decreased by one unit. Note that, unlike a default self-assessment with eight subject topics, this assessment had nine topics. Also, note that the scales of the graphs vary based on the maximum score (4 or 5) of an individual evaluation, and display the actual output from the Tool.
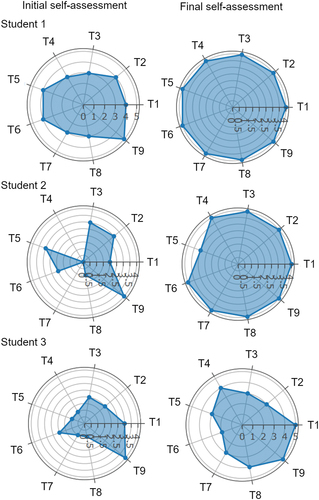
Table 1. Details of the self-assessment datasets examined in this study.
Table 2. The subject topics of the examined self-assessments in brief. See Appendix 1 for detailed descriptions.
Table 3. Change (the proportion of students with positive changes, no changes, or negative changes) in their self-assessed knowledge and understanding in geoinformatics subject topics between the initial and final self-assessments in the basic and advanced courses at UEF. See for the frequencies of the self-assessment scores related to each subject topic in each course.
Table 4. The subject topic where the students had the highest and lowest self-assessed knowledge and understanding in the initial and final assessments in the Basic and Advanced courses at UEF. The acronyms of the subject topic are explained in (i.e. Tn). Each self-assessment subject topic is mentioned briefly when first mentioned.
Figure 3. Students’ self-assessed median knowledge and understanding (1 = low, 5 = high) at the end of a course across all course subject topics.
Figure 4. Distribution of self-assessments scores at the end of a course across the course subject topics. See for the description of course subject topics.
Figure 5. Individual categories denoting the impacts of utilising the Geoportti self-assessment Tool on studying and learning processes as perceived by the students. A response from one student (n = 206) could link to several impacts. In total, the various impacts were mentioned 285 times for studying, and 262 times for learning (100%).
Table A.1. The frequencies of the self-assessment scores related to each subject topic given in the Basic and Advanced courses at UEF. The largest frequencies are colored. The comparison of scores between the initial and final self-assessments shows the negative, no change (same value in initial and final self-assessment), or positive change in the self-assessed knowledge and understanding between the initial and final self-assessments.
Table A2. The percentages (as a percentage of all students) of gender and main study field categories among students with positive, no, and negative change trends between the initial and final self-assessments. See the n values for respondents from .
Table A3. Differences (percentages) between the student’s background and the perceived impact of utilising the Geoportti self-assessment tool on studying and learning, which is distinguished based on the “no or negative” impacts and positive impacts. Statistically significant differences between groups were tested through the Pearson chi square test (the significant result is bolded).
TableS6_Advanced_UEF_2019_final.csv
Download Comma-Separated Values File (855 B)TableS1_Basic_UTU_2020_final.csv
Download Comma-Separated Values File (1.8 KB)TableS2_Basic_UEF 2020_final.csv
Download Comma-Separated Values File (1.4 KB)TableS4_RemoteSensing_UTU_2019_final.csv
Download Comma-Separated Values File (524 B)TableS8_ParticipatoryMapping_UTU_2019_final.csv
Download Comma-Separated Values File (356 B)TableS7_Advanced_UEF_2020_final.csv
Download Comma-Separated Values File (1.1 KB)TableS3_Basic_UEF_2021_final.csv
Download Comma-Separated Values File (1.5 KB)TableS5_RemoteSensing_UTU_2020_final.csv
Download Comma-Separated Values File (860 B)TableS10_Impacts_on_studying_and_learning.csv
Download Comma-Separated Values File (59.4 KB)TableS9_ParticipatoryMapping_UTU_2021_final.csv
Download Comma-Separated Values File (308 B)Data availability statement
The data supporting the analysis presented in this article is available in the Supplementary Material. However, the UEF data regarding initial and final self-assessment results is not published due to the potential identification of individual student responses.