
Figures & data
Table 1. Comfort with staff actions: Principal axis factor analysis with Oblique (promax) rotation.
Figure 1. Shows the percentage of responses across the scale for each item. The top four items make up the personalised interactions factor whilst the bottom five items measure the sexualised interaction factor.
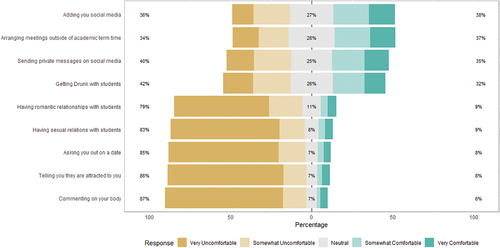
Figure 2. Average scores for each of the main effects on sexualised interactions.
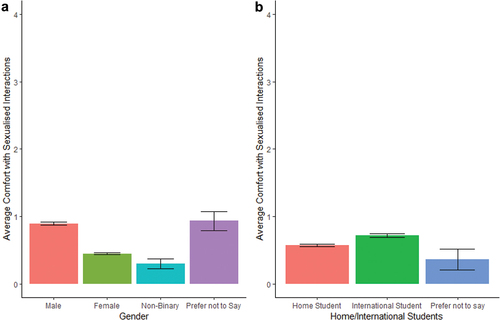
Table 2. Negative binomial regression exploring students’ perceptions towards sexualised interactions with staff.
Figure 3. Average scores across each of the main effects on personalised interactions (error bars = SE).
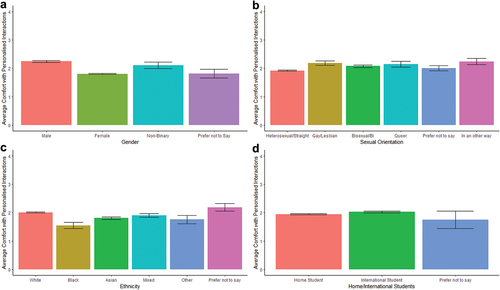
Table 3. Multiple regression exploring the effects of demographics on students’ comfort with personalised interactions with staff.