Figures & data
Fig. 1 Locality maps A, Simplified paleogeographical map showing the New Zealand, Australia and Antarctica region for the period around 96 million years ago. The positions of some localities mentioned in the paper are shown. Based on Veevers et al. (Citation1991). B, The position of the Chatham Island group with respect to the mainland of New Zealand. C, The main Chatham Island with Pitt Island to its south. Rectangle over Pitt Island shows area enlarged in D. D, Northern Pitt Island and the location (black circles) of the fossil samples.
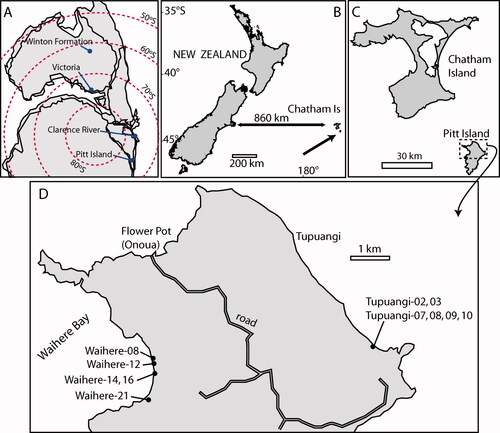
Fig. 2 Chronostratigraphic stages of the mid-Cretaceous. Left column shows the international stages. Middle column shows the correlative New Zealand stages. Right column shows the palynostratigraphic zonation of Raine (Citation1984). LB = Lycopodiacidites bullerensis Assemblage Zone. TS = Trichotomosulcites subgranulatus Assemblage Zone. PM1 = Phyllocladidites mawsonii Assemblage Zone. Ma = millions of years ago. Correlation follows Crampton (Citation2004) and Cooper (Citation2004).
Table 1. Sample details
Fig. 3 Ginkgo sp. A, TLM view of two stomatal complexes (SL5572, scale = 50 μm); B, TLM view of single stomatal complex with at least four papillae (SL5572, scale = 20 μm); C, SEM view of the inner cuticular surface showing one stomatal complex (S-1755, scale = 10 μm); D, SEM view of the outer cuticular surface showing one stomatal complex with six papillae (S-1755, scale = 10 μm).
Fig. 4 Araucariaceae: Araucaria rangiauriaensis sp. nov.; A, SEM view of a single leaf (S-1727, scale = 1 mm); B, TLM view of stomatal zone (SL5575, scale = 50 μm); C, SEM view of outer surface of a stomatal zone showing obliquely oriented stomata (S-1727, scale = 20 μm); D, SEM view of the inner cuticular surface of a stomatal zone (SL5575, scale = 20 μm); E, TLM view of typical epidermal cells (SL5575, scale = 20 μm); F, TLM view of a single stomatal complex (SL5575, scale = 40 μm).
Fig. 5 Araucariaceae form 1 (A–F), and Araucariaceae form 2 (G–H). A, TLM view of obliquely oriented stomatal complexes (SL5552, scale = 50 μm); B, TLM view of single stomatal complex (SL5552, scale = 20 μm); C, SEM view of inner surface with many stomata (S-1725, scale = 50 μm); D, SEM view of inner surface showing two stomata (S-1725, scale = 10 μm); E, SEM of outer surface showing three stomatal pores (S-1725, scale = 20 μm); F, TLM of typical epidermal cells. Note the wavy walls. (SL5675, scale = 20 μm); G, TLM view with four obliquely oriented stomata and some surrounding epidermal cells, each with a central, dark papilla (SL5715, scale = 50 μm); H, TLM view of single stomatal complex with a slit-like aperture (SL5715, scale = 20 μm).
Fig. 6 Araucariaceae form 3. A–D, Specimens with a larger ‘cyclicity’ than normal: A, SL5675 (scale = 50 μm); B, SL5675 (scale = 50 μm); C, SL5728 (scale = 50 μm); D, SL5724 (scale = 50 μm).
Fig. 7 Cheirolepidiaceae: Otwayia sp. (all SL5577). A, TLM view of the distal portion of a single leaf (scale = 400 μm); B, TLM view of typical epidermal cells (scale = 20 μm); C, TLM view with four stomata (scale = 40 μm); D, TLM view of a single stomata with focus at level of the fused papillae surrounding the pore (scale = 20 μm); E, TLM view of a single stomata with focus at level of the stomatal flanges (scale = 20 μm).
Fig. 8 Podocarpaceae: Eromangia sp. (all SL5676). A, TLM view of the distal portion of a single leaf (scale = 200 μm); B, TLM view of a single stomatal complex (scale = 20 μm); C, TLM view of typical epidermal cells. Note the sinuous walls (scale = 20 μm).
Fig. 9 Podocarpaceae: Kakahuia sp. A, TLM view showing scattered stomata and prominent papillae (SL5566, scale = 50 μm); B, TLM view of a single stomata surrounded by papillae (SL5566, scale = 20 μm); C, SEM view of outer surface showing stomata with stomatal pores very subdued (S-1749, scale = 20 μm); D, SEM view of inner surface with many stomata (S-1749, scale = 20 μm); E, F, TLM views of typical epidermal cells on non-stomatal surface (SL5566, scale = 20 μm).
Fig. 10 Podocarpaceae sp. ‘short epidermal cells’. A, SEM view of apical to near-basal, portion of a leaf (S-1763, scale = 0.5 mm); B, TLM view of a single leaf, showing a ‘frill’ of ctenoidally oriented epidermal cells on either edge near the base (SL5759, scale = 0.5 mm); C, TLM of leaf apex showing mucronate point (SL5747, scale = 200 μm); D, TLM view of stomatal complexes (SL5731, scale = 50 μm); E, SEM view of inner surface of single stomatal complex (S-1763, scale = 10 μm); F, SEM view of outer surface showing a single stomatal complex. Note raised rim of subsidiary cells that is itself sunken below outer level of epidermal cells (S-1763, scale = 10 μm); G, TLM view of single stomatal complex (SL5644, scale = 20 μm); H, TLM view showing characteristic short epidermal cells (SL5731, scale = 20 μm).
Fig. 11 Podocarpaceae sp. ‘chained’. A, TLM view of stomatal rows. Note darker staining (thicker) subsidiary cell cuticle (SL5642, scale = 50 μm); B, TLM view of single stomatal complex showing strong rim. (SL5643, scale = 20 μm); C, TLM view of stomatal rows (SL5643, scale = 50 μm); D, TLM view (SL5711, scale = 50 μm); E, SEM view of outer surface showing stomatal rows with prominent ring of raised subsidiary cells (S-1757, scale = 20 μm); F, SEM view of inner surface of a stomatal complex (S-1757, scale = 10 μm).
Fig. 12 Podocarpaceae sp. ‘non-chained’. A, TLM view of stomatal complexes showing a distinct lack of chaining, and complexes that tend to be closer to those in a neighbouring row (SL5758, scale = 50 μm); B, TLM view of single stomatal complex (SL5758, scale = 20 μm); C, TLM view of typical epidermal cells (SL5758, scale = 50 μm); D, TLM view of single stomatal complex (SL5758, scale = 20 μm); E, SEM view of outer surface of a stomatal complex lacking any distinct rim around pore (S-1750, scale = 10 μm); F, SEM view of inner surface of stomatal complex (S-1750, scale = 10 μm).
Fig. 13 Podocarpaceae sp. ‘compressed’. A, TLM of a single leaf lacking the base, (SL5660, scale = 50 μm); B, TLM view of two stomatal zones (SL5658, scale = 100 μm); C, TLM view showing compressed stomatal complexes (SL5658, scale = 50 μm); D, TLM view of a single stomatal complex (SL5658, scale = 20 μm); E, TLM view of typical epidermal cells (SL5658, scale = 50 μm); F, SEM view of outer surface of a stomatal zone showing characteristic raised periclinal surfaces of all cells (S-1753, scale = 20 μm); G, SEM of inner surface of a stomatal complex (S-1753, scale = 10 μm).
Fig. 14 Podocarpaceae sp. ‘sinuous’ (A, B) and sp. cf. Katikia inordinata (C, D). A, TLM view of stomatal zone. Note strongly sinuous epidermal cell walls (SL5567, scale = 50 μm); B, TLM view of single stomatal complex (SL5567, scale = 20 μm); C, TLM view of stomatal zone (SL5668, scale = 50 μm); D, TLM view of stomatal zone. Left arrow indicates a lateral subsidiary cell shared between two stomatal complexes. Right arrow indicates a shared polar subsidiary cell that is completely enclosed by lateral subsidiary cells (SL5668, scale = 50 μm).
Fig. 15 Taxodiaceae or Taxaceae: Paahake sp. A, TLM view of stomatiferous zone (above) and non-stomatiferous zone (below) (SL5693, scale = 50 μm); B, TLM view of stomatal complex showing papillae overarching pore (SL5693, scale = 20 μm); C, SEM view of outer surface of a stomatiferous zone showing prominent papillae (S-1748, scale = 50 μm); D, SEM of inner surface of stomatiferous zone (S-1748, scale = 20 μm); E, TLM view of typical epidermal cells (SL5693, scale = 20 μm); F, SEM of inner surface of stomatiferous zone (S-1748, scale = 50 μm).
Fig. 16 Charcoal. A, TLM view showing abietinean to mixed type of pitting on the radial walls of tracheids (SL5547, scale = 50 μm); B, TLM view showing radial pitting with a short chain of flattened pits, separated by Sanio's rims (SL5547, scale = 20 μm); C, TLM enlarged view of a wood ray with taxodioid oculipores looking like small oopores (SL5547, scale = 20 μm); D, SEM view illustrating cross-field pitting as seen from tracheid side, with narrowly bordered oculipores, the apertures of which are horizontally oriented (S-1730, scale = 10 μm).
Fig. 17 Angiosperm Parataxon CUT-Z-GEF. A, SEM view of outer adaxial surface (S-1735, scale = 20 μm); B, SEM view of outer adaxial surface (S-1745, scale = 10 μm); C, SEM of inner adaxial surface showing base of trichome (left) and stomatal complex (right) (S-1745, scale = 10 μm); D, SEM view of inner adaxial surface of single stomatal complex (S-1745, scale = 10 μm); E, TLM view of adaxial surface showing stomatal complexes and trichome (SL5753, scale = 50 μm); F, TLM view of stomatal complex with poorly distinguished contact cells with a vaguely radial orientation and attached by a short edge (SL5715, scale = 20 μm); G, TLM view of stomatal complex showing a tangentially oriented polar subsidiary cell at base and a small lateral subsidiary cell at right (SL5715, scale = 20 μm). H, TLM view of stomatal complex showing an arcuate tangential division, which has produced a cuspate lateral subsidiary cell (left of stoma). A tangentially oriented polar subsidiary cell (top of stoma) may also be the result of a tangential division (SL5715, scale = 20 μm).
Fig. 18 Angiosperm Parataxon CUT-Z-GEF. A, TLM view of abaxial surface showing single persistent trichome (SL5755, scale = 50 μm); B, TLM view of marginal tooth (SL5777, scale = 0.5 mm).
Fig. 19 Angiosperm Parataxon CUT-Z-GEG. A, TLM view (SL5559, scale = 50 μm); B, TLM view of stomatal complex (SL5559, scale = 20 μm); C, Angiosperm leaf macrofossil (scale = 10 mm).