
Figures & data
Figure 1. Higher education access gaps.
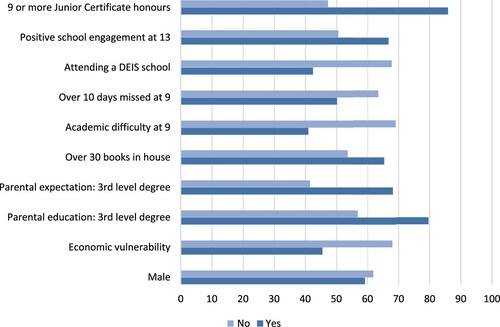
Figure 2. Higher education pathway gaps.
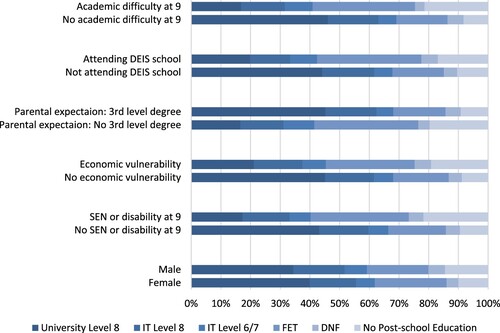
Figure 3. Key characteristics by disability status.
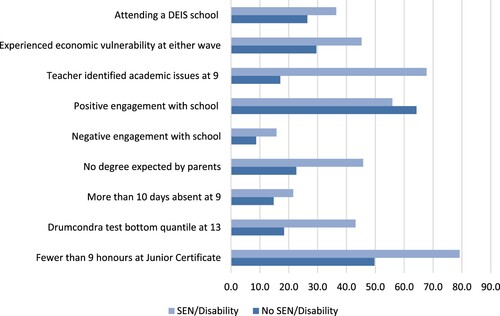
Figure 4. Disability type by key socioeconomic factors.
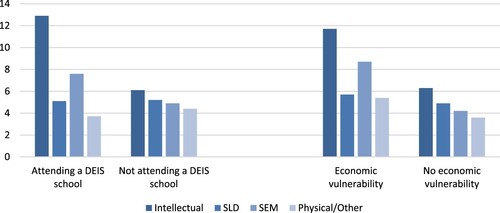
Figure 5. Key characteristics by DEIS status.
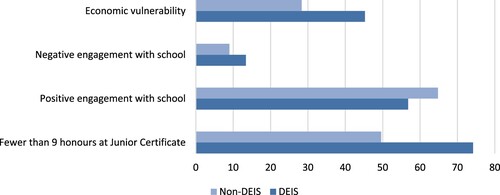
Table 1. Binary regression results for higher education attendance.
Table 2. Multinomial logistic regression results for post-school setting.
Table A1. Descriptive statistics: Percentage participating in HE.
Table A2. Descriptive statistics: percentage in different postsecondary pathways.
Data availability statement
The data that support the findings of this study are available from Ireland’s Central Statistics Office (CSO). Restrictions apply to the availability of these data, which were used under licence for this study. Data may be obtained by registered research organisations with the permission of the Central Statistics Office. Growing Up in Ireland (GUI) is funded by the Department of Children, Equality, Disability, Integration and Youth (DCEDIY). It is managed by DCEDIY in association with the CSO. Results in this paper are based on analyses of data from Research Microdata Files provided by the CSO. Neither the CSO nor DCEDIY take any responsibility for the views expressed or the outputs generated from these analyses.