
Figures & data
Table 1. Demographic data (N = 405).
Table 2. Educational and Occupational Aspirations (N = 395).
Table 3. Factors Influencing Consideration to Leave School (N = 94).
Table 4. Self-Efficacy Scores (N = 397).
Figure 1. Self-efficacy scores and gender (N = 388).
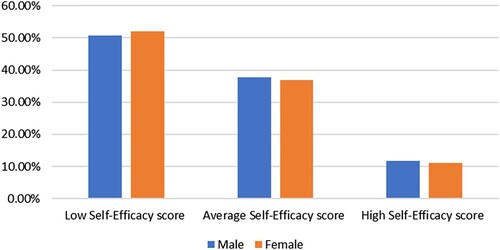
Table 5. Sense of belonging questionnaire.
Table 6. Descriptive Statistics for Sense of Belonging Scale (N = 391).
Table 7. Gender differences on dimensions of school belonging.
Table 8. Differences between groups according to consideration of early school-leaving.
Table 9. Correlations between dimension scores on self-efficacy and sense of school belonging scales.