
Figures & data
Figure 1. Coefficient of variation in real GDP per capita for the Nordic countries, Western Europe, Southern Europe, and Eastern Europe, 1822–2008 (Five-Year Moving Average). Source: GDP per capita figures from Maddison Project Database (version 2013); See: Bolt and van Zanden (Citation2014). Nordic: Denmark, Finland, Norway and Sweden; Western Europe: Austria, Belgium, France, Germany the Netherlands, Switzerland, Britain, Ireland; Southern Europe: Portugal, Spain, Italy, Greece; Eastern Europe: Albania, Bulgaria, Hungary, Poland, Romania, Bosnia, Croatia, Macedonia, Slovenia, Montenegro, Serbia, Kosovo, Czech republic, Slovakia, Belarus, Estonia, Latvia, Lithuania, Moldova, Russia, Ukraine.
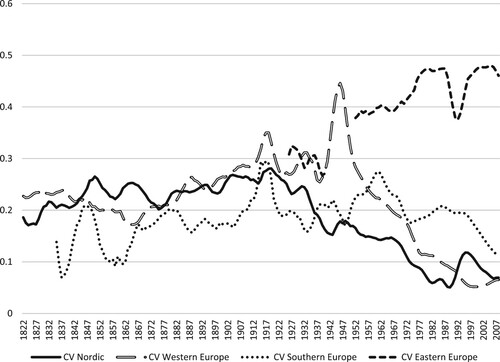
Figure 2. Nordic GDP per capita as a share of British GDP per Capita, 1822–1910, and US GDP per Capita, 1916–2008 (Five-year Moving Averages). Source: GDP per capita figures from Maddison Project Database (version 2013); See: Bolt and van Zanden (Citation2014). The Nordic GDP per capita is weighted by population, population figures from Bolt et al. (Citation2018).
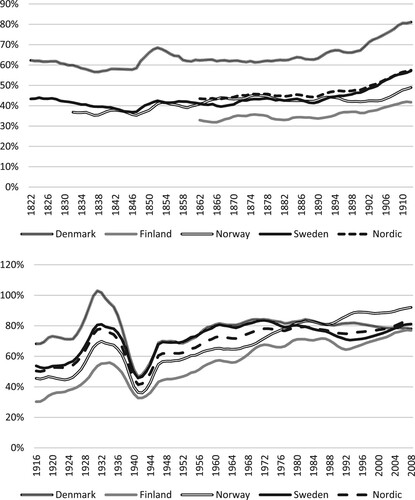
Figure 3. Nordic adjusted silver wages (in 1850 Silver Price) as a share of London, 1730–1908 (Eleven-year Moving Averages). Source: See Appendix B1: Data sources for wages.
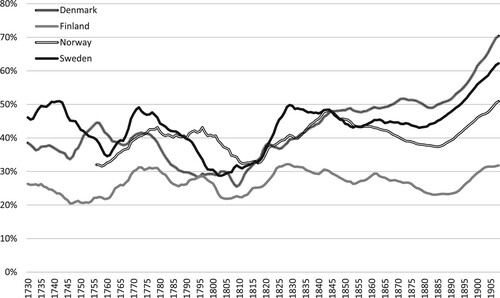
Table 1. Testing for GDP convergence using unit root tests.
Table 2. Testing for GDP convergence using unit root tests by subperiod.
Table 3. Testing for wage convergence using unit root tests.
Table 4. Testing for wage convergence using unit root tests by subperiod.