Figures & data
Table 1. Overview of the nine sessions in the ACT module.
Table 2. Statements about the course content and self-evaluation.
Table 3. Demographic characteristics of the participants at baseline.
Table 4. Comparison of demographics at baseline between completers, semi-completers, and dropouts.
Table 5. Strengths and limitations of the eHealth ACT module.
Table 6. Means and standard deviations time spent online on each session and in total (hh:mm:ss).
Figure 1. Rating Percentages per session.
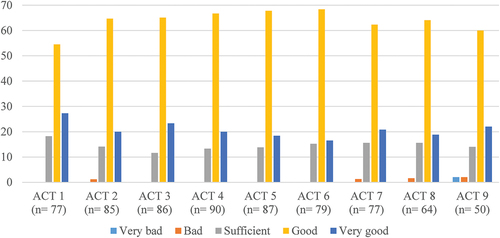
Figure 2. Results of the content evaluation statements.
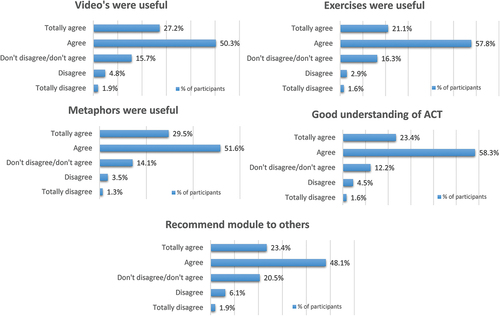
Figure 3. Results of the statements relating to the self-evaluation.
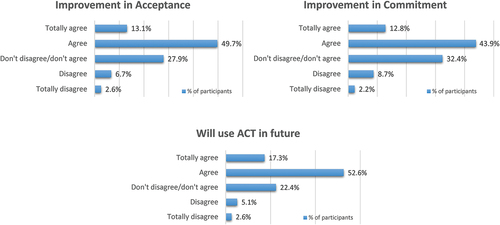
Figure A1. Instruction video.

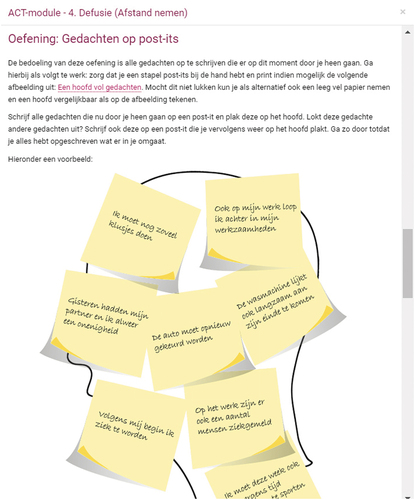
Figure A2. Illustrated metaphor.

Figure A3. Guided exercise.

Figure A4. Fill in exercise.

Figure A5. Practical exercise.