
Figures & data
Figure 1. A schematic diagram of the known genes within the pathways for biosynthesis of important flavor compounds in hop. Question marks denote pathways that are yet unproven in the literature to our knowledge.
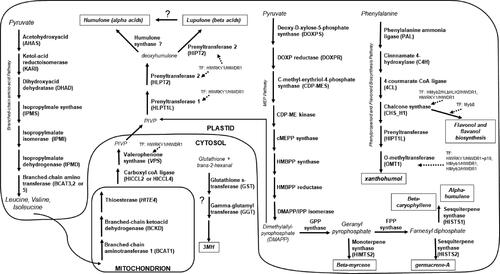
Table 1. Sequencing results of 27 libraries, showing the total number of raw input reads, the average length of mapped reads, as well as the percent of reads that were uniquely mapped, mapped multiple times, the percent of the total reads that were mapped to the reference genome, and the percent GC content of the library.
Figure 2. A heatmap of gene expression patterns scaled across development stages for putative homologs of genes within the branched-chain amino acid (BCAA) biosynthesis and degradation pathways. The order of the genes from top to bottom represents the order of the pathway from the biosynthesis of the BCAAs to their degradation in the mitochondria as the precursors to the bitter acids. Gene acronyms are defined in . The XLOC numbers refer to the gene sequence available on hopbase.org. There are multiple XLOC numbers for many genes because there are multiple copies of the gene, errors in the assembly, or uncertainty in the annotation. Asterisks indicate expression levels are significantly different from the previous developmental stage with a BH-adjusted p-value < 0.05. * = logfold-change > 2 or < -2; ** = logfold-change > 4 or < -4; *** = logfold-change > 6 or < -6.
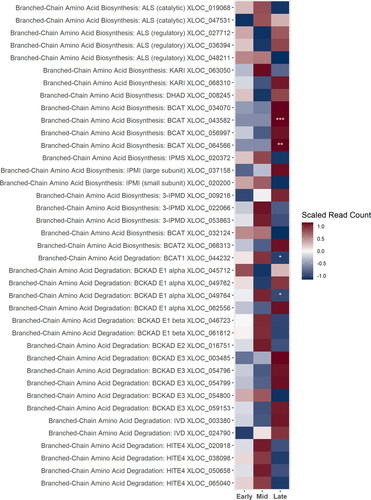
Figure 3. A heatmap of gene expression patterns scaled across development stages for putative homologs of genes within the bitter acid biosynthesis pathway. The order of the genes from top to bottom represents the order of the pathway from the degradation of the BCAAs in the cytosol to the formations of the bitter acids in the plastid. Gene acronyms are defined in . The XLOC numbers refer to the gene sequence available on hopbase.org. There are multiple XLOC numbers for some genes because there are multiple copies of the gene, errors in the assembly, or uncertainty in the annotation. Asterisks indicate expression levels are significantly different from the previous developmental stage with a BH-adusted p-value < 0.05. * = logfold-change > 2 or < -2; ** = logfold-change > 4 or < -4; *** = logfold-change > 6 or < -6.
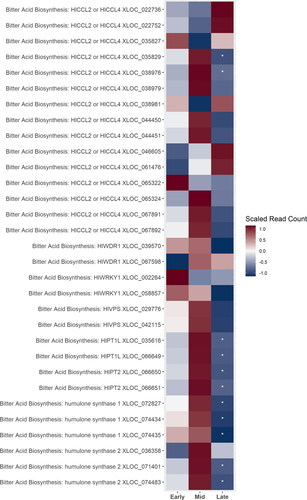
Figure 4. A heatmap of gene expression patterns based on FPKM with hierarchical clustering of expression based on sample and transcript.
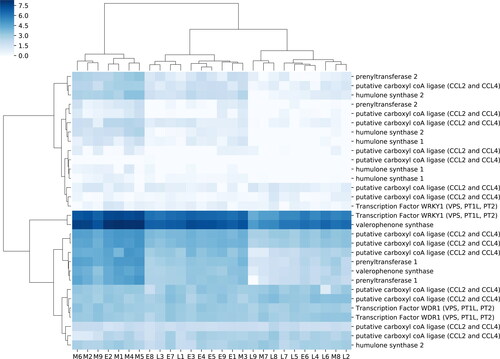
Figure 5. A heatmap of gene expression patterns scaled across development stages for putative homologs of genes within the xanthohumol biosynthesis pathway. The order of the genes from top to bottom represents the order of the pathway from the initial conversion of phenylalanine to the biosynthesis of xanthohumol. Gene acronyms are defined in . The XLOC numbers refer to the gene sequence available on hopbase.org. There are multiple XLOC numbers for many genes because there are multiple copies of the gene, errors in the assembly, or uncertainty in the annotation. Asterisks indicate expression levels are significantly different from the previous developmental stage with a BH-adusted p-value < 0.05. * = logfold-change > 2 or < -2; ** = logfold-change > 4 or < -4; *** = logfold-change > 6 or < -6.
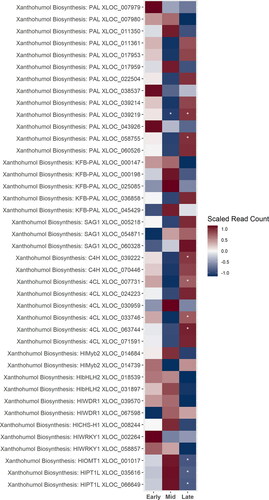
Figure 6. A heatmap of gene expression patterns that were significantly different in at least one development stage scaled across treatments for putative homologs of genes within the volatile secondary metabolites, or “hop oil” biosynthesis pathway. Not all putative homologs of genes within these pathways are shown for simplicity. XLOC numbers refer to the gene sequence available on hopbase.org. Asterisks indicate expression levels are significantly different from the previous developmental stage with a BH-adusted p-value < 0.05. * = logfold-change > 2 or < -2; ** = logfold-change > 4 or < -4; *** = logfold-change > 6 or < -6.
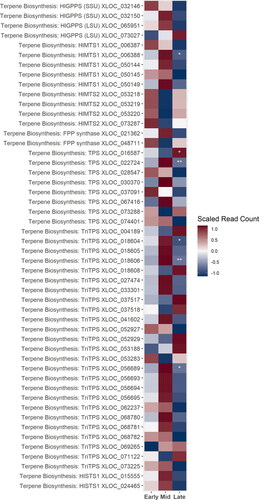
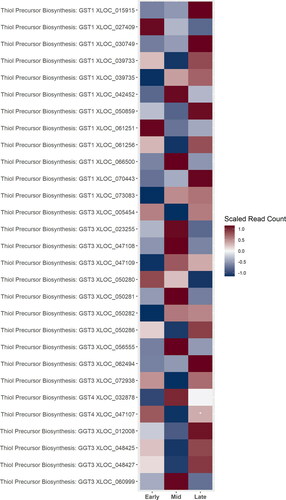
Figure 7. A heatmap of gene expression patterns scaled across development stages for putative homologs of genes within the thiol precursor biosynthesis pathway. Gene acronyms are defined in . XLOC numbers refer to the gene sequence available on hopbase.org. Asterisks indicate expression levels are significantly different from the previous developmental stage with a BH-adusted p-value < 0.05. * = logfold-change > 2 or < -2; ** = logfold-change > 4 or < -4; *** = logfold-change > 6 or < -6.
Data availability statement
The data will be published at hopbase.org upon publication.