
Figures & data
Table 1. Summary statistics, analysis of variance, least significant difference, coefficient of variation and broad-sense heritability for grains characteristics of different barley genotypes.
Table 2. Descriptive statistics, least significant difference at 5%, coefficient of variation, analysis of variance and broad-sense heritability of malt quality traits of different malted genotypes.
Table 3. Correlation and the contribution (%) of studied traits to the first three principal components of the principal component analysis.
Figure 1. Pearson correlations coefficient among measured traits. Positive correlations are displayed in blue and negative correlations in red. The intensity of the color and the size of the circles are proportional to the correlation coefficients. The color legend shows the correlation coefficients and the corresponding colors. Thousand kernel weight (TKW), hectoliter weight (HW). Percentage of plump grains (Plump). Seed area (Area), Seed length (Length). Seed width (Width). Seed perimeter (Perimeter). Barley protein (BP). Starch content (Starch). Malt extract (ME). Malt protein (MP). Soluble proteins (SP). Kolbach index (KI). *significant at p < 0.05, ** significant at p < 0.01, *** significant at p < 0.001.
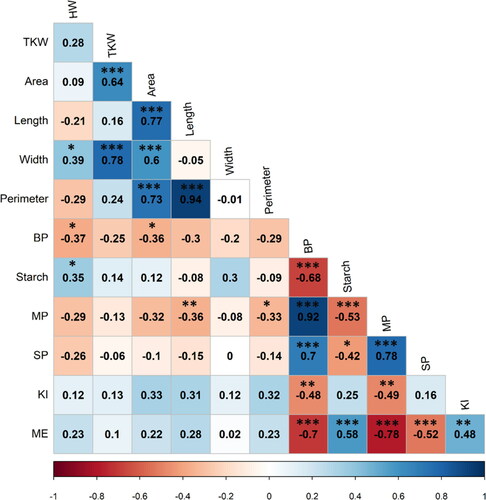
Figure 2. Biplot of the first two dimensions (PC1 and PC2) of the principal component analysis (PCA) for the 36 genotypes based on their significant physicochemical and malt traits. The clusters were obtained by the hierarchical cluster analysis using Ward’s method by calculating the Euclidean distance. Variables contribution to explained variation (Var.contrib). Hectoliter weight (HW), thousand kernel weight (TKW), seed area (Area), seed length (Length), seed width (Width), seed perimeter (Perimeter), barley protein (BP), grain starch content (Starch), malt protein (MP), soluble protein (SP), malt extract (ME), Kolbach index (KI).
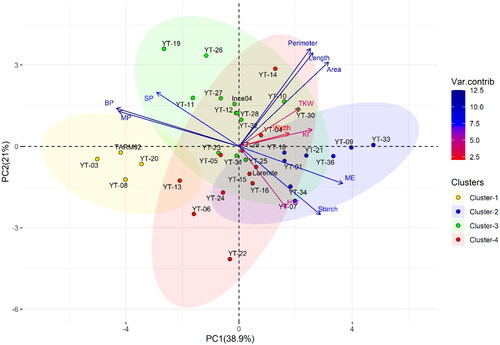
Figure 3. Dendrogram of 36 barley genotypes based on twelve grain and malt quality parameters. Pedigree information of each genotype plotted on the left vertical axis.
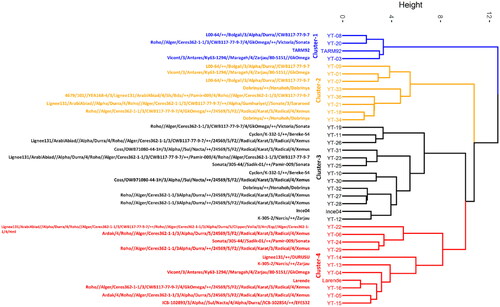
Table 4. Mean value, minimum, maximum, and standard deviation of grain physicochemical and malt quality traits in the four clusters of 36 barley genotypes.
Figure 4. Heatmap and hierarchical clustering for physicochemical and malt quality traits in the 20 selected genotypes. Genotype names on the vertical axis. Variables names on the horizontal axis. Hectoliter weight (HW), percentage of plump grain (Plump), malt friability (MF), malt extract (ME), Kolbach index (KI), free amino nitrogen (FAN), α-amylase (AAL). Bright blue indicates lowest values while bright red indicates highest values for each trait.
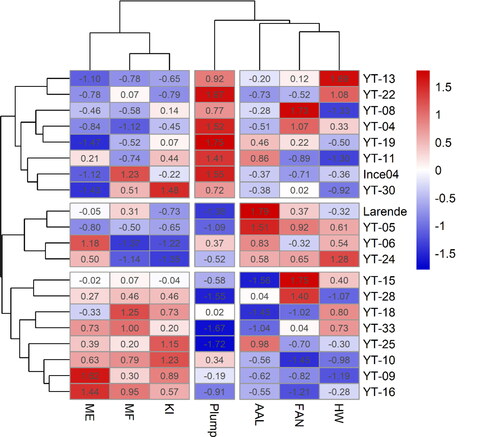
Table 5. Weighted score for selected genotypes based on seven quality traits as described by Kumar et al.[23] (free amino nitrogen and alpha-amylase included).