
Figures & data
Table 1. ICP-OES calibration details.
Table 2. Overview of the hopping levels and hop products applied for the benchtop wort boiling trials.
Figure 1. Analysis of variance (ANOVA) applied to the concentrations of selected metals quantitated in wort and hot trub samples obtained by benchtop wort boiling trials. Concentrations in hot trub were converted according to determined dry matter. Displayed are means of the three independent replicates, error bars represent standard deviations. *Significant differences (p ≤ 0.05). **Highly significant differences (p ≤ 0.001).
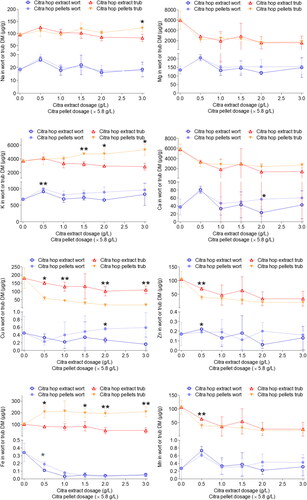
Table 3. Original gravity, real extract, alcohol, degree of fermentation, color, pH, and bitterness in the beer samples.
Table 4. Frequency of the flavor attributes selected by the panelists (N = 16) during CATA sensory evaluation of the beers produced with different whirlpool hop additions.
Figure 2. Radical generation in beer samples at forced oxygen exposure monitored over time by ESR spectroscopy at 60 °C.
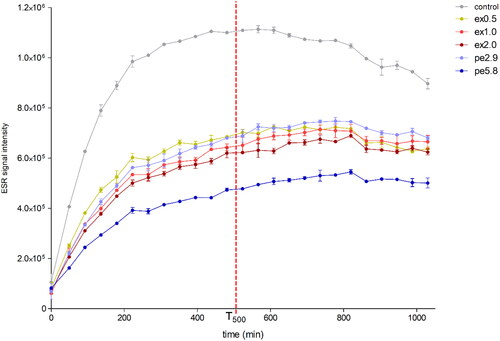
Table 5. Cochran’s Q test applied to the beer sensory results obtained by CATA with a trained sensory panel over 12 weeks of forced aging.
Figure 3. Overall aging scores of the six beers produced with different whirlpool hop dosages of pellets or extract over the 12 weeks of forced aging at 30 °C displayed in % as calculated with the CATA frequencies of the age-related flavor attributes caramel, cardboard, dried fruit, honey, nutty, overripe fruit, and sweet aromatic.
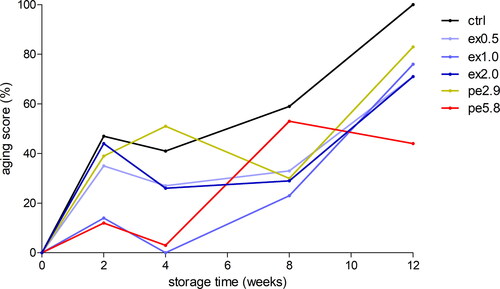
Figure 4. Correspondence Analysis (CA) and Cochran’s Q test (p ≤ 0.05) applied to the beer sensory results obtained by CATA with a trained sensory panel over 12 weeks of forced aging displayed as factors F1 vs. F2 (left) and factors F1 vs. F3 (right) overall accounting for 57.04% of the total variation.
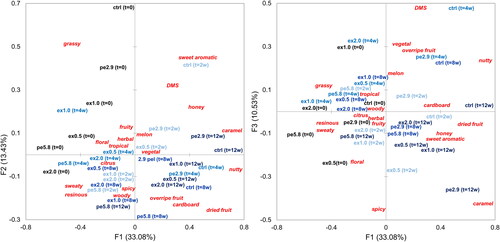
Table 6. ANOVA and Fisher multiple comparison applied to the beer sensory results obtained by CATA over 12 weeks of forced aging comparing 5 different time points and excluding attributes not exhibiting significant differences between samples or time points according to Cochran’s Q test (p ≤ 0.05).
Table 7. ANOVA and Fisher multiple comparison applied to the beer sensory results obtained by CATA over 12 weeks of forced aging comparing 6 different hop dosages and excluding attributes not exhibiting significant differences between samples or time points according to Cochran’s Q test (p ≤ 0.05).