
Figures & data
Figure 1. Sample paths for the diffusion model and the Lévy flight model.
Note: Panel (a): Sample paths of the diffusion model with normally distributed noise, i.e., α = 2.Panel (b): Sample paths of a Lévy flight model with more heavy-tailed Cauchy-distributed noise, i.e., α = 1.
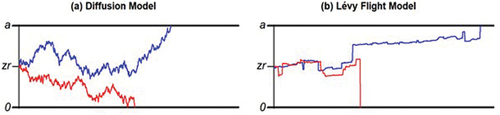
Table 1. Mean parameter values, response times, and accuracy rates in the letter-number-discrimination task and participant characteristics for the two age groups.
Figure 2. Kernel density of mean alpha-values for the two age groups in the letter-number-discrimination task.
N = 40 in each group. Circles at the bottom represent individual α-values of the participants.
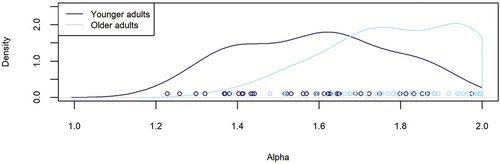
Table 2. Goodness of fit for the diffusion model vs. Lévy flight model.