Figures & data
Figure 1. Biofuel pathways and stage of technology readiness. See text for details.
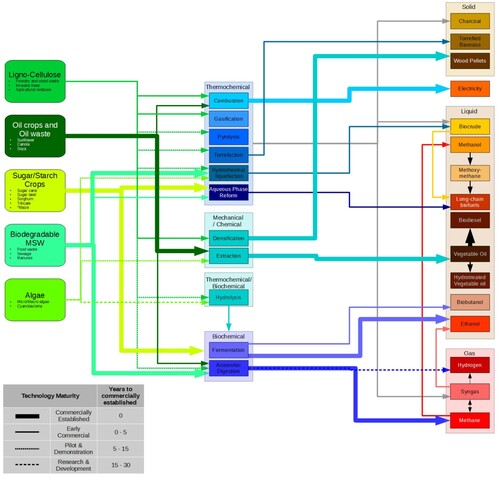
Figure 2. Biofuel feedstock, conversion process and energy carrier readiness from pathways shown in .
Notes: AD, anaerobic digestion; APR, aqueous phase reforming; HTL, hydrothermal liquefaction; HVO, hydrogenated vegetable oil. See text for details.
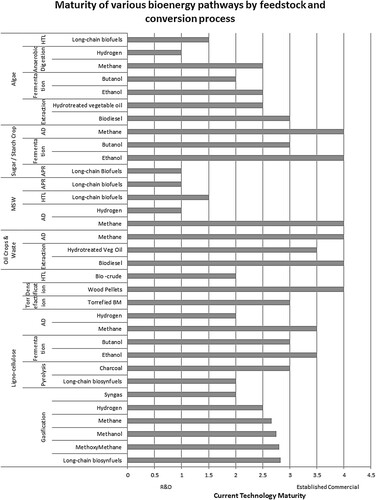
Figure 3. Technology readiness and/or suitability of various prime-movers for different energy carriers.
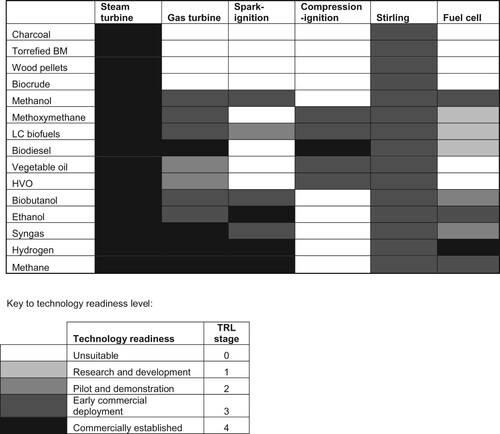
Figure 4. Net energy efficiency of biofuels (biomass-to-wheel) from feedstock production to end-use in transportation.
Notes: Life-cycle energy efficiency = (energy output/energy input) × 100. Adapted from Schubert et al. (Citation2008).
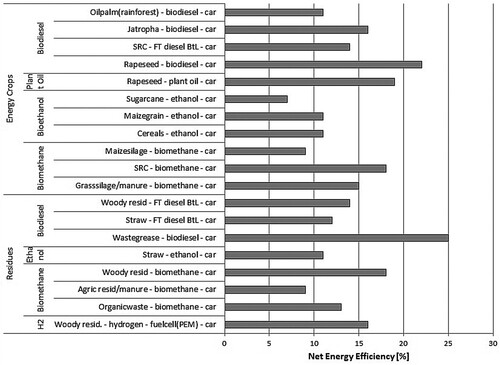
Table 1. Yields of biofuels and co-products per land area.
Figure 5. Biofuel production cost, compared to diesel and petrol equivalents. Assumes oil price of either 40–80 US$/bbl or 100–140 US$/bbl). (USD/bbl = US$ per barrel oil). Adapted from IRENA (Citation2016b).
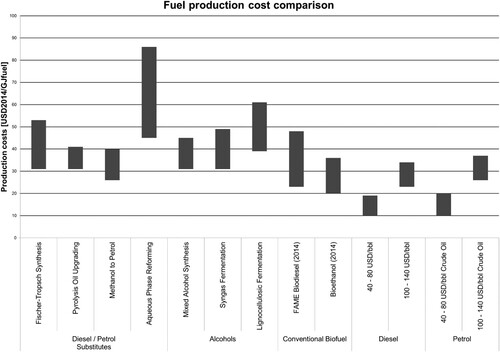
Figure 6. Greenhouse gas emissions of biofuels from lignocellulose feedstocks and energy crops, compared to reference fossil fuels (petrol and diesel). Adapted from IEA (Citation2008).
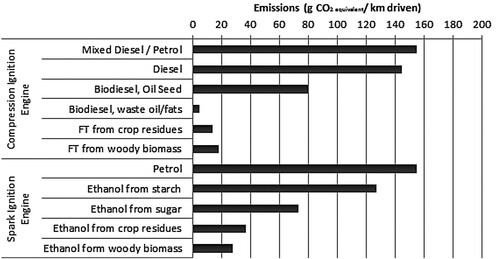
Figure 7. Meta-analysis of greenhouse gas emission reductions of various biofuels, compared to reference fossil fuels (diesel and petrol). The assessments exclude indirect land-use change. Emission savings of more than 100% are possible through use of co-products. BtL = biomass-to-liquid; FAME = fatty acid methyl esters; HVO = hydrotreated vegetable oil. Results are from numerous LCA studies; the figure is adapted from IEA (Citation2011a).
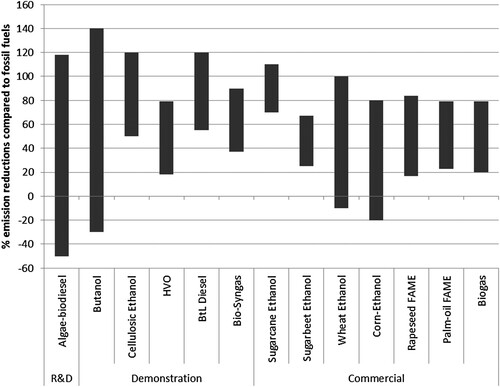
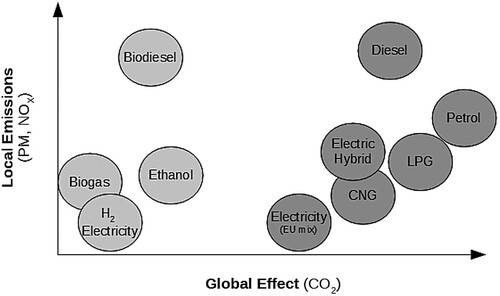
Figure 8. Diagrammatic representation of the performance of biofuels compared to petroleum fuels in terms of global effect (greenhouse gas emissions) and local emissions (air pollutants). Adapted from the Baltic Biogas Bus (Citation2009).