
Figures & data
Figure 1. Eswatini’s fiscal challenges. (a) Fiscal balances in SADC members, average for 2010–19 (% of GDP). (b) Government expenditures on education in SADC members (% of GDP). (c) Gross tertiary enrolment rates in SADC members (%), average of the last 10 years. Source: World Bank Development Indicators and IMF World Economic Outlook databases.
Note: DRC for Democratic Republic of Congo.
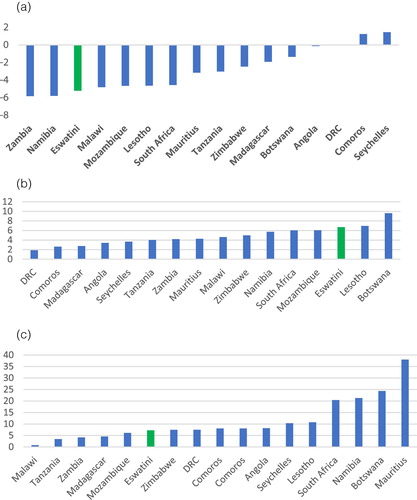
Figure 2. Female unemployment rates in SADC members. 2014–19 average (% of female labour force). Source: World Bank Development Indicators, ILO estimates.
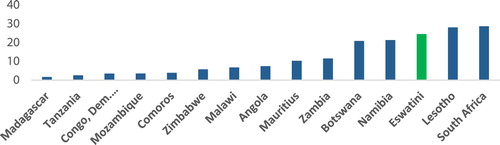
Table 1. Overall labour market outcomes in Eswatini, by gender, 2007, 2010 and 2013.
Table 2. Unemployment including discouraged workers, (% of relevant labour force).
Table 3. Employment (% of work. age pop. with relevant education), by gender.
Figure 3. Changes in labour market outcomes, in percentage points, from 2007 to 2013. Source: Authors’ calculations based on the Eswatini Labor Force Surveys.
Note: pp = percentage points.
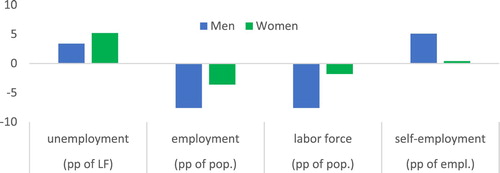
Figure 4. Security of wage employment, by gender, 2007 and 2013. Share of wage employees with formal contract (%). Source: Authors’ calculations based on the Eswatini Labor Force Surveys.
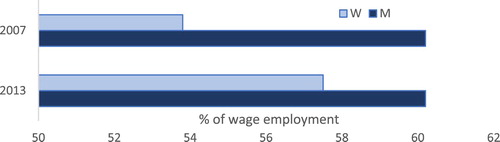
Table 4. Sectoral distribution of employment, by gender and age, 2007 (% of total employment in each age category).
Figure 5. Labour force participation in 2007 and 2013, by gender (% of population). Source: Authors’ calculations based on the Eswatini Labor Force Surveys.
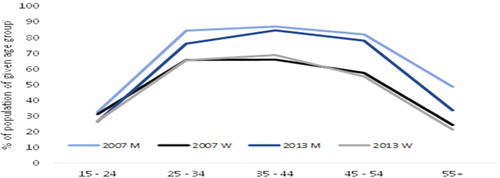
Table 5. Official remittance inflows to Eswatini and other countries in the region.
Table 6. Share of employed with tertiary education, by gender and type of employment.
Table 7. Gender and self-employment (logit regressions; dependent var. is self-employed = 1).
Figure 6. Gender gaps in earnings, 2007, 2010 and 2013 (in % of male income). Source: Authors’ calculations based on the Eswatini Labor Force Surveys.
Figure 7. Kernel density estimate of (log of) income from wage employment, by gender. (a) Log of income from wages in 2007. (b) Log of income from wages in 2013. Source: Authors’ estimations based on the Eswatini Labor Force Surveys.
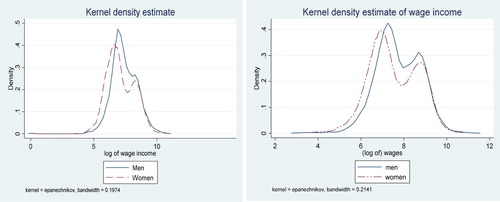
Figure 8. Kernel density estimate of (log of) income from self-employment, by gender. (a) In 2007. (b) In 2013. Source: Authors’ estimations based on the Eswatini Labor Force Surveys.
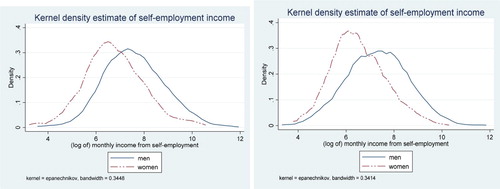
Table 8. Oaxaca–Blinder decomposition of gender wage gaps in Eswatini, 2007–13.
Table 9. Oaxaca–Blinder decomposition of net income from self-employment (log).