Figures & data
Figure 1 Map of the study area indicating the sampling sites (P I and P II) in the Tijuca River, Tijuca National Park, Rio de Janeiro, Rio de Janeiro state, Brazil.
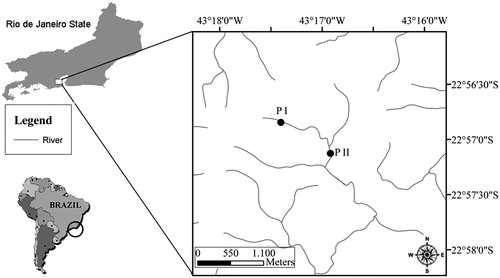
Figure 2 Mini-piezometers and the position of the perforated bands at the different sampling depths.
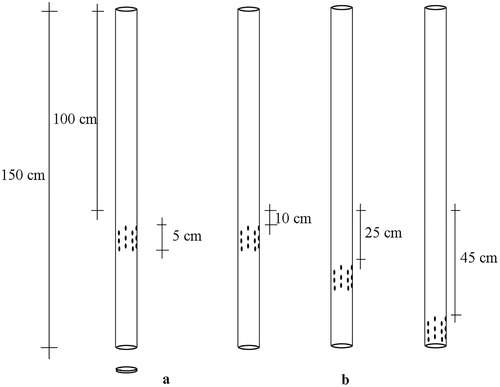
Figure 3 Sample rarefaction tests, error 5%, for Chironomid larvae at P I and P II sampling sites in Tijuca river, Rio de Janeiro.
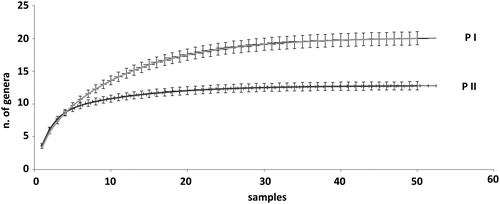
Table 1 Chironomidae genera and 13 morphological characteristics (traits).
Table 2 Abundance of Chironomid genera at different depth and habitats, and total abundance (%) for each depth.
Figure 4 A, richness and B, abundance of chironomid individuals at different depths and sampling sites in Tijuca River, Rio de Janeiro. Different lowercased letters show significative differences.
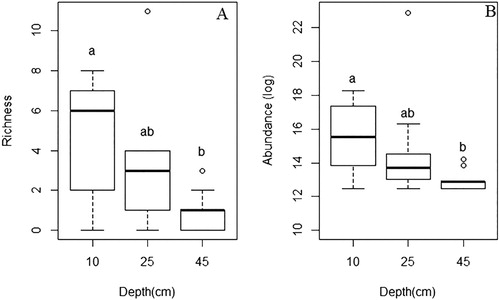
Figure 5 Richness at different microhabitats at sampling sites in Tijuca River, Rio de Janeiro. A, upstream of riffles; B, downstream of riffles; C, lateral side of pools; D, areas of sand accumulation (bars, curves). Different lowercased letters show significant differences.
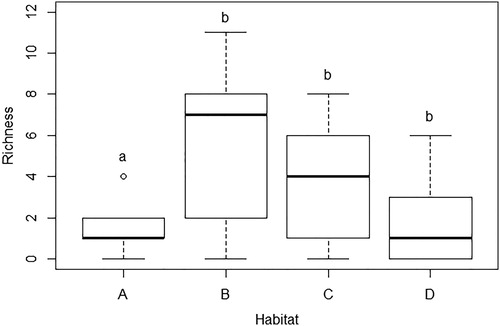
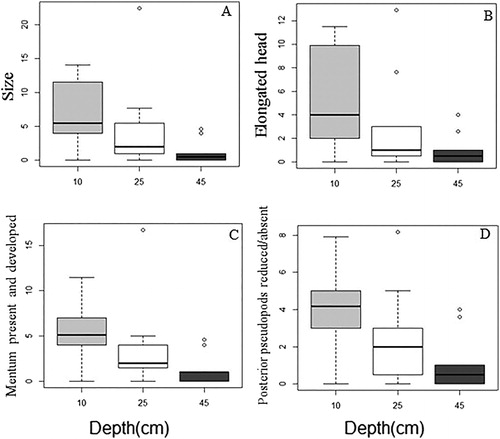
Figure 6 Percentage of chironomid morphological characteristics on different depths at sampling sites in Tijuca River, Rio de Janeiro. A, body size; B, elongated head; C, mentum present and developed versus depth; D, posterior pseudopods reduced or absent versus depth.