
Figures & data
Figure 1. Cumulative Raman-saliva studies. Each subject area has seen an exponential-like rise in publications particularly since the late 2000s. Bars in (blue) dentistry, (yellow) medicine, (green) drugs and (red) forensics. Included publications are listed in Supporting Information . Based on this observation, it would be expected that total papers on the Raman analysis of saliva to exceed 200 by 2025.
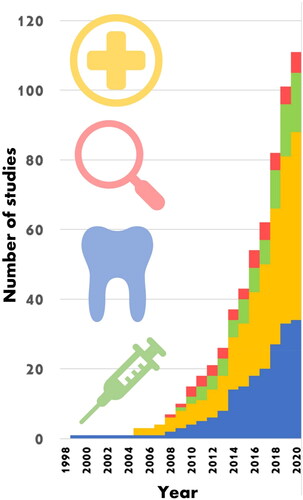
Figure 2. Raman peak assignment on cancerous saliva samples (n = 732). An overview pie chart of the most prominent peaks in the literature displayed by their biomolecular group. A subset of the Raman-saliva literature with a perceived focus on chemometrics has been analyzed. Further details are included in Supporting Information, and Table S3.
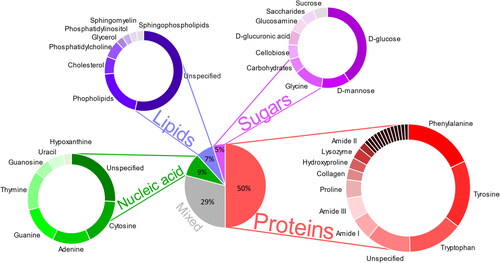
Table 1. Details of illicit drug Raman-saliva studies.
Figure 3. Raman bands analyzed in Raman-saliva studies for common illicit drugs. A. Cannabis, B. Cocaine, C. Heroin, D. Methamphetamine. Most prominent bands marked with *. Background is three saliva spectra for assessment of potential overlap with innate saliva Raman bands (Based on Ref. (Citation91)).
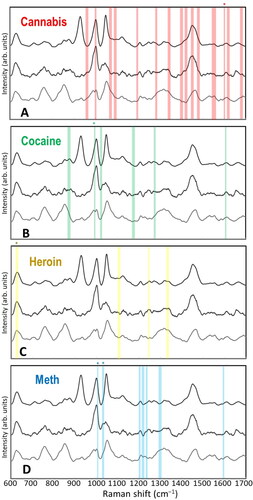
Table 2. Composition of artificial saliva.
Figure 4. Portable Raman microfluidic devices. Dielectrophoretic nanoparticle aggregation for on-demand SERS. (a) Schematic representation of DEP-SERS chip with a PDMS microchannel sandwiched between a glass cover and an electrode substrate with pipette tips forming fluidic reservoirs. (b) Illustration of the trap zones (c) Close-up view of a single trap zone. (d) SERS spectra obtained from the DEP-SERS. SERS microfluidic chip for the detection of drugs of abuse in saliva including: (e) Schematic representation of the microfluidic device indicating where the Ag-NP suspension, sample and salt are loaded on to the device and driven through the channel via a vacuum pump. (f) Visualization of the flow-focusing junction using a fluorescent dye. (g) Schematic of the complete reaction. Reprinted with permission from.[Citation81,Citation88]
![Figure 4. Portable Raman microfluidic devices. Dielectrophoretic nanoparticle aggregation for on-demand SERS. (a) Schematic representation of DEP-SERS chip with a PDMS microchannel sandwiched between a glass cover and an electrode substrate with pipette tips forming fluidic reservoirs. (b) Illustration of the trap zones (c) Close-up view of a single trap zone. (d) SERS spectra obtained from the DEP-SERS. SERS microfluidic chip for the detection of drugs of abuse in saliva including: (e) Schematic representation of the microfluidic device indicating where the Ag-NP suspension, sample and salt are loaded on to the device and driven through the channel via a vacuum pump. (f) Visualization of the flow-focusing junction using a fluorescent dye. (g) Schematic of the complete reaction. Reprinted with permission from.[Citation81,Citation88]](/cms/asset/0172169b-0c78-48ae-b2e5-166a7b02e477/laps_a_2130351_f0004_c.jpg)
Supplemental Material
Download MS Word (1 MB)Data availability statement
All data used in meta-analyses are available in Table S1 in Supporting Information.