
Figures & data
Figure 1. Mean SRS – IIAs signed by five EU Countries, 1990–2000.
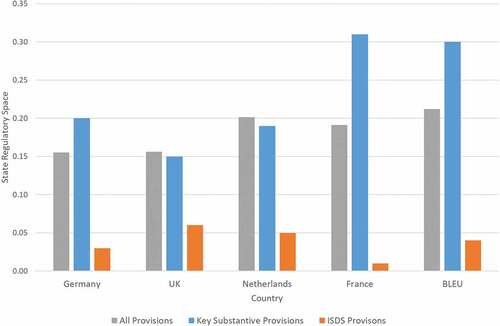
Figure 2. SRS for model BITs and IIAs signed by four EU member states.
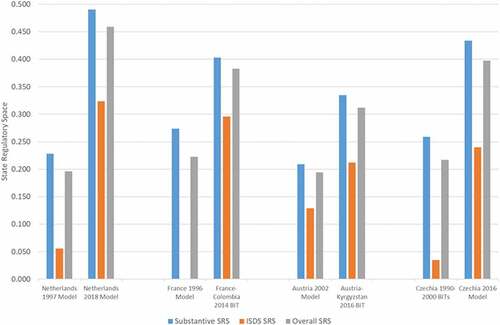
Figure 3. Annual three-year moving average of SRS in IIAs signed by member states, the EU, and the rest of the world.
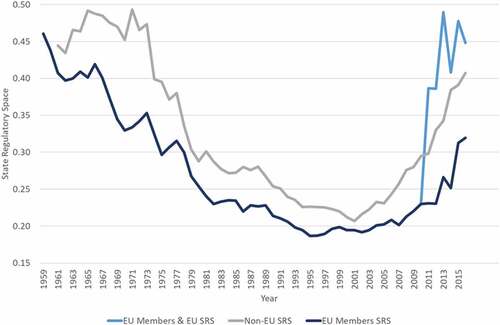
Figure 4. SRS in CETA, CPTPP, 2015 Brazil model BIT, and 2015 India model BIT.
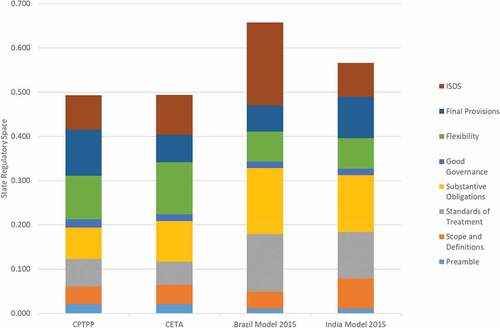
Table A1: Coding state regulatory space in IIAs: Variables, dimensions and categories.
Table A2: Key events – EU IIA policies, 2007–2020.