Figures & data
Figure 1. Study area: east of Val-d’Or city, Quebec province, Canada. (a) The location of the study area and reference data provided by photo interpretation. The ground plots have been used for independent validation in this study. Bioclimatic domains of Quebec province and disturbances information provided by Ministère des Ressources naturelles et des Forêts (MINISTÈRE DES RESSOURCES NATURELLES ET DES FORÊTS Citation2017). (b) Examples of aerial imagery with a spatial resolution of 30 cm and the corresponding reference data provided by photo interpretation.
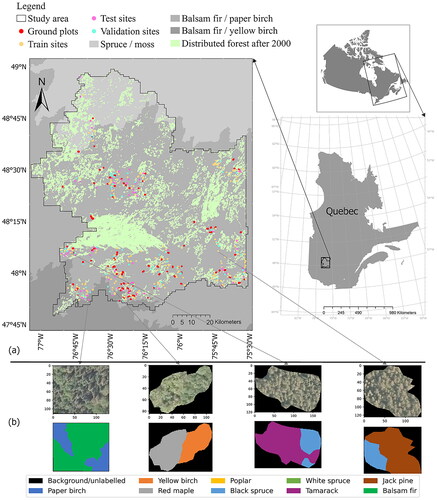
Table 1. List of predictor variables used in this study.
Figure 2. Flow diagram of tree species classification procedure in this study.
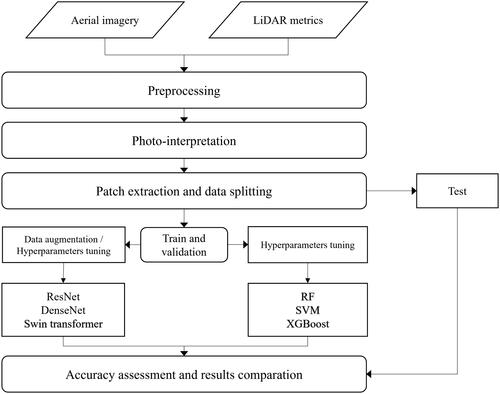
Figure 3. Sample extraction strategy used in this study: (a) Example of a site, (b) Example patches (samples) for DL models, and (c) Sample extraction strategy for DL and ML approaches.
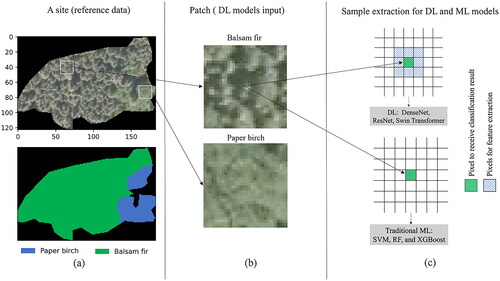
Figure 4. Distribution of samples (total: 614582) for training (solid border and high color saturation), validation (square dot border and medium color saturation), and testing (dash border and low color saturation) for each tree species class.
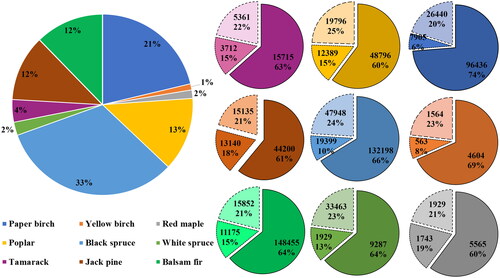
Table 2. Swin Transformer hyperparameters.
Table 3. Random search parameters used in the ML models.
Figure 5. Obtained results using different data sources and combination approach by evaluated classifiers in terms of overall accuracy.
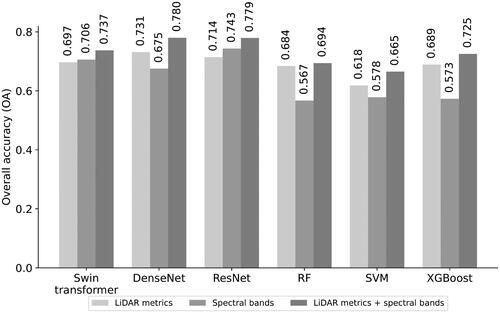
Figure 6. Effect of patch size W on deep learning models classification performance.
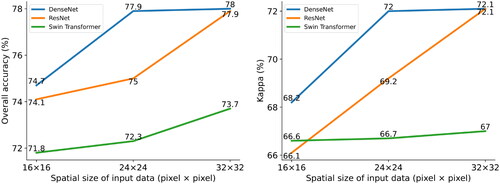
Figure 7. Obtained producer accuracy, user accuracy and F1-score for different classes using a combination of LiDAR metrics and spectral bands by different classifiers.
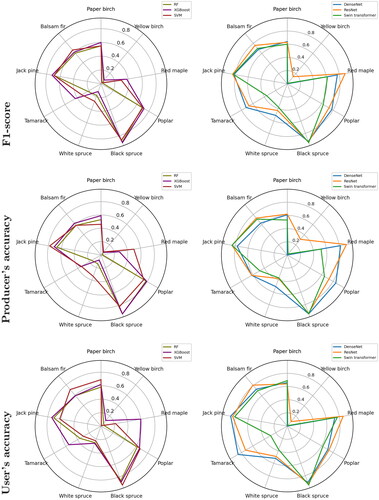
Figure 8. Normalized confusion matrixes obtained based on test samples using combination of LiDAR and spectral bands by the different methods. UA: user’s accuracy and PA: producer’s accuracy.
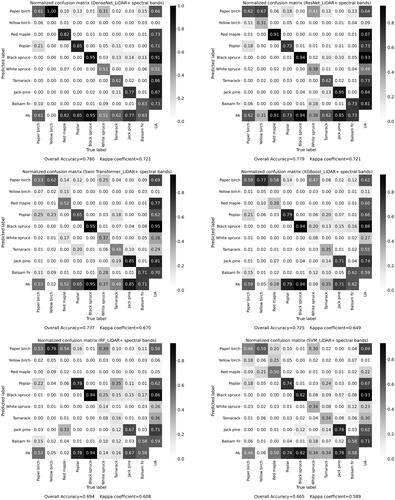
Table 4. Obtained overall accuracy and kappa index by different methods. The best and median class for each model is determined based on the obtained F1-score.
Table 5. Computational time for different methods.
Figure 9. Map produced by DenseNet for three independently ground plot examples. (a) RGB image, (b) fields measurement of basal area per species (c) predicted map using DenseNet (d) predicted covering pixel per species.
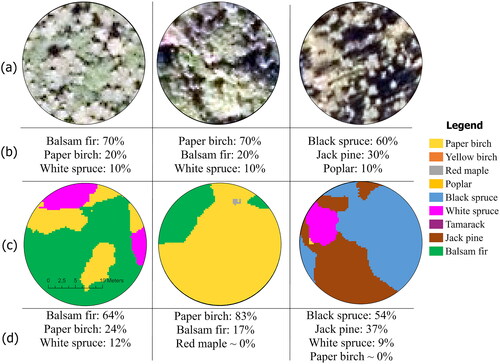
Table 6. Producer accuracy (PA), user accuracy (UA), overall accuracy (OA), kappa index (K) and F1-score were obtained by different methods using the field-dominant species information and the frequently predicted class in evaluated ground plots.
Figure 10. Embedding features distribution shown by t-SNE of 1000 randomly selected samples of datasets (PB: paper birch, YB: yellow birch, RM: red maple, PO: poplar, BS: black spruce, WS: white spruce, TA: tamarack, JP: jack pine and BF: balsam fair).
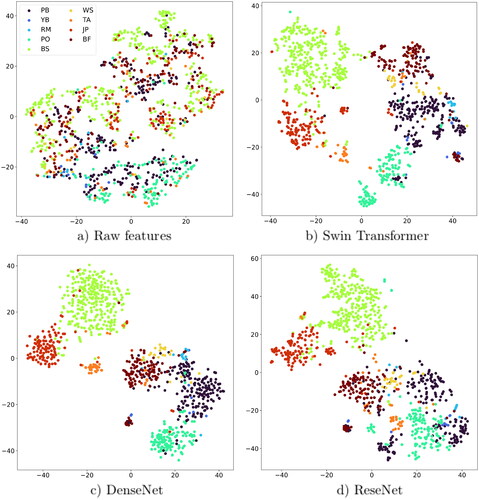
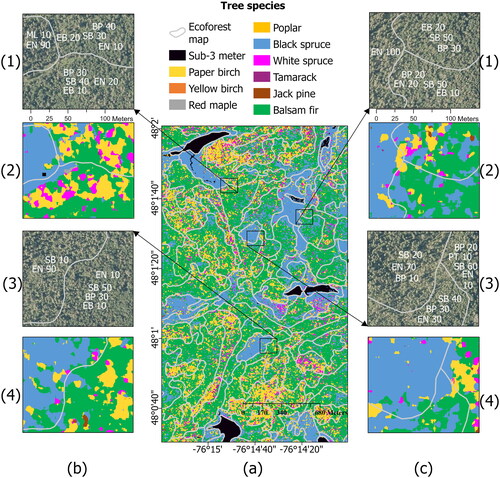
Figure 11. (a) Tree species map produced by DenseNet overlaid with forest stands produced by their inventory (photo-interpreted) species groups. (b,c).1 and 3: Original RGB orthoimage.2 and 4: Predicted map using DenseNet.The numbers provided alongside each species show the proportion of crown closure occupied by that specific species within the stand. SB: balsam fir, BP: paper birch, EN: black spruce, EB: white spruce, PT: Poplar.