Figures & data
Fig. 1 Changes in wind stress (vectors; N m−2) and its curl (coloured shading; 10−8 N m−3) under CO2 quadrupling with (a) CMIP5 model ensemble mean and (b) CESM1 (4×CO2 minus CTRL). A mean of model years 41–90 of each run is used for analysis.
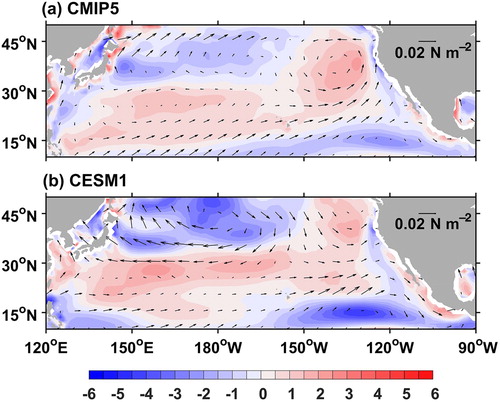
Table 1. CESM1 and POP2 experiments.
Fig. 2 Changes in the North Pacific subtropical total mass transport streamfunction (colour shading; 1 Sv = 106 m3 s−1) in the overriding experiments with CESM1: (a) total response (4×CO2 minus CTRL), (b) replication of total response (τ4c4 minus τ1c1), (c) wind stress effect (τ4c4 minus τ1c4), and (d) thermal warming effect (τ1c4 minus τ1c1). The black contours show the streamfunction distribution in the CTRL run. The mean of model years 41–90 of each run is taken for analysis. Stippling in (a) indicates significance at the 99% confidence level from a Student’s t-test.
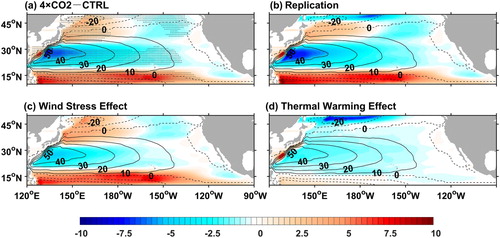
Fig. 3 Changes in the North Pacific subtropical total mass transport streamfunction (colour shading; 1 Sv = 106 m3 s−1) in response to quadrupled CO2 from eight individual CMIP5 models [CCSM4, Centre National de Recherches Météorologiques Coupled Global Climate Model, version 5 (CNRM-CM5), Commonwealth Scientific and Industrial Research Organization-Mark 3.6.0 (CSIRO-Mk3.6.0), Geophysical Fluid Dynamics Laboratory-Earth System Model, version 2G (GFDL-ESM2G), Geophysical Fluid Dynamics Laboratory-Earth System Model, version 2M (GFDL-ESM2M), Goddard Institute for Space Studies Model E2, coupled with the Russell ocean model (GISS-E2-R), Hadley Centre Global Environmental Model, version 2, with an Earth System component (HadGEM2-ES), and L’Institut Pierre-Simon Laplace Coupled Model, version 5A, medium resolution (IPSL-CM5A-MR)] and their ensemble mean. A mean of model years 41–90 of each run is used for analysis.
![Fig. 3 Changes in the North Pacific subtropical total mass transport streamfunction (colour shading; 1 Sv = 106 m3 s−1) in response to quadrupled CO2 from eight individual CMIP5 models [CCSM4, Centre National de Recherches Météorologiques Coupled Global Climate Model, version 5 (CNRM-CM5), Commonwealth Scientific and Industrial Research Organization-Mark 3.6.0 (CSIRO-Mk3.6.0), Geophysical Fluid Dynamics Laboratory-Earth System Model, version 2G (GFDL-ESM2G), Geophysical Fluid Dynamics Laboratory-Earth System Model, version 2M (GFDL-ESM2M), Goddard Institute for Space Studies Model E2, coupled with the Russell ocean model (GISS-E2-R), Hadley Centre Global Environmental Model, version 2, with an Earth System component (HadGEM2-ES), and L’Institut Pierre-Simon Laplace Coupled Model, version 5A, medium resolution (IPSL-CM5A-MR)] and their ensemble mean. A mean of model years 41–90 of each run is used for analysis.](/cms/asset/f1f97253-dca6-43c7-9e01-dede0eae8abd/tato_a_1666701_f0003_oc.jpg)
Fig. 4 Changes in zonal currents (colour shading, cm s−1) zonally averaged over 140°E–180° in the overriding experiments with CESM1: (a) total response (4×CO2 minus CTRL), (b) replication of total response (τ4c4 minus τ1c1), (c) wind stress effect (τ4c4 minus τ1c4), and (d) thermal warming effect (τ1c4 minus τ1c1). The superimposed black contours show the zonal velocity distribution in the CTRL run (solid lines for eastward and dashed lines for westward). The black (red) vertical lines in (a) indicate the average positions of the core of the KE and NEC, respectively, in the CTRL run (4×CO2). The position of the core of the KE (NEC) is defined as the latitude of the maximum westward (eastward) velocity averaged in the upper 250 m between 30° and 40°N (10° and 20°N). A mean of model years 41–90 of each run is used for analysis.
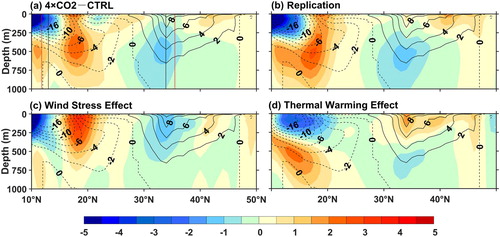
Fig. 5 Wind stress curl (N m−3) zonally averaged over the North Pacific basin for the CTRL run (black curve), CO2 quadrupling run (red curve), and changes between the CTRL and CO2 quadrupling runs (4×CO2 minus CTRL, blue curve). A mean of model years 41–90 of each run is used for analysis.
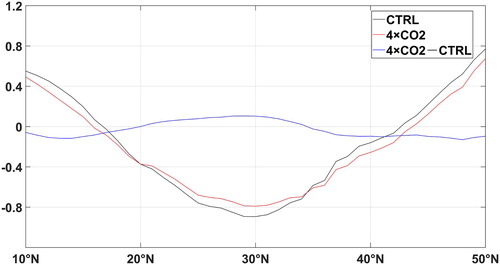
Fig. 6 Changes in regional dynamic height change (dyn cm with reference to 2 × 10⁷ Pa) zonally averaged over the North Pacific basin in the overriding experiments with CESM1: (a) total response (4×CO2 minus CTRL), (b) replication of total response (τ4c4 minus τ1c1), (c) wind stress effect (τ4c4 minus τ1c4), and (d) thermal warming effect (τ1c4 minus τ1c1). The superimposed black contours show the distribution of RDH in the CTRL run. A mean of model years 41–90 of each run is used for analysis.
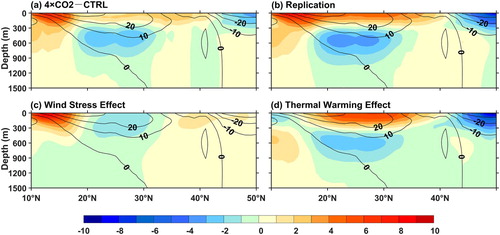
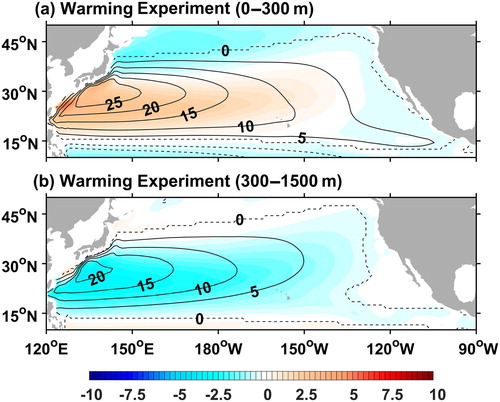
Fig. 7 Change in the North Pacific subtropical streamfunction (colour shading, 1 Sv = 106 m3 s−1) of the upper ocean (0–300 m, left column) and lower thermocline (300–1500 m, right column) in the overriding experiments with CESM1: (a) and (b) replication of total response (τ4c4 minus τ1c1), (c) and (d) wind stress effect (τ4c4 minus τ1c4), and (e) and (f) thermal warming effect (τ1c4 minus τ1c1). The black contours show the streamfunction distribution in the CTRL run. A mean of model years 41–90 of each run is used for analysis.
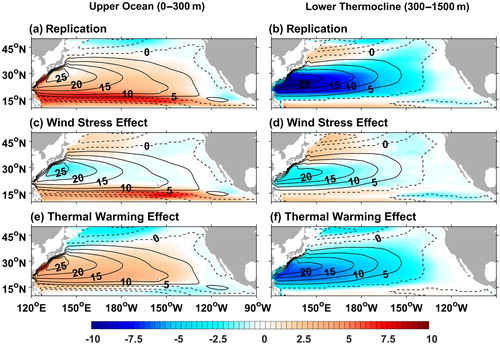
Fig. 8 Change in stratification (g m−3) in the overriding experiments with CESM1: (a) total response (4×CO2 minus CTRL), (b) replication of total response (τ4c4 minus τ1c1), (c) wind stress effect (τ4c4 minus τ1c4), and (d) thermal warming effect (τ1c4 minus τ1c1). And the contribution of (e) temperature and (f) salinity changes to the stratification changes. Stratification is defined as the potential density difference between 600 and 200 m (g m−3). A mean of model years 41–90 of each run is used for analysis.
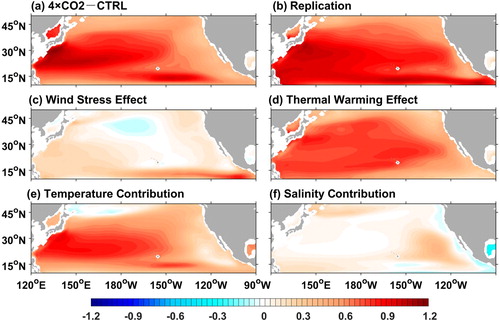
Fig. 9 Change in the North Pacific subtropical streamfunction (colour shading, 1 Sv = 106 m3 s−1) of the (a) upper ocean and (b) lower thermocline in the warming experiments with POP2 (PERT_POP minus CTRL_POP). The black contours show streamfunction distribution in CTRL_POP. A mean of model years 31–50 of each run is used for analysis.