Figures & data
Fig. 1 Wavenumber-frequency spectra of (a) 200 hPa and (b) 850 hPa zonal wind anomalies averaged over 10°S-10°N based on ERA-interim reanalysis (Dee et al., Citation2011) for the winter half year (November-April) from 1980–2018. Frequency values 0.02 and 0.05 correspond to periods of 50 and 20 days, respectively. Positive (negative) frequencies are for eastward (westward) propagating waves.
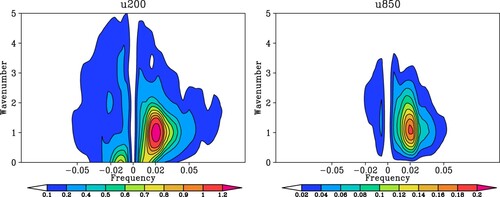
Fig. 2 Wavenumber-frequency spectra of 15°S–15°N symmetric (left) and antisymmetric (right) components of precipitation rate divided by the background spectrum based on the Global Precipitation Climatology Project one-degree daily data (GPCP 1DD V1.2; Huffman et al., Citation2001) for the period of 1997–2013, following the approach of Wheeler and Kiladis (Citation1999). Superimposed are the dispersion curves of equatorial waves for the equivalent depths of 12, 25 and 50 m.
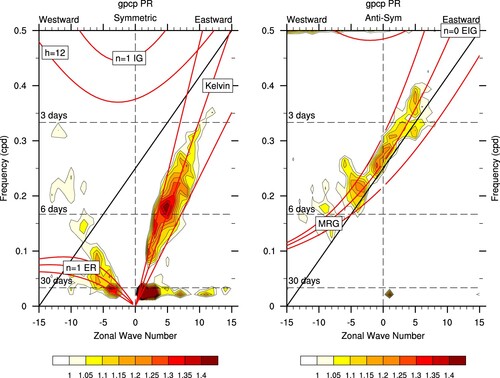
Fig. 3 Composites of the precipitation rate anomaly in the tropics for eight phases of the MJO, during extended boreal winter based on the pentad data of the Climate Prediction Center (CPC) Merged Analysis of Precipitation (CMAP) (Xie & Arkin, Citation1997). The phase numbers are marked on the right of each panel. The calculation procedure is the same as for of Lin et al. (Citation2009), except that an updated CMAP data version (v1708) with the period of 1979–2017 is used here.
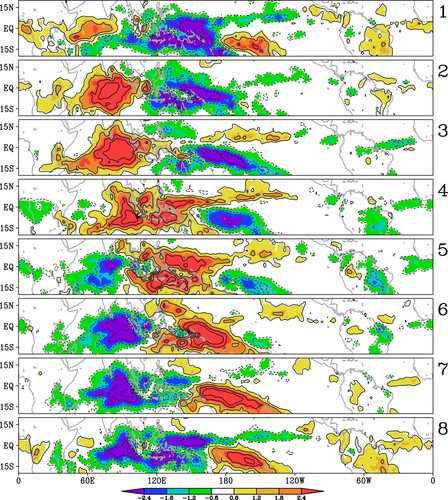
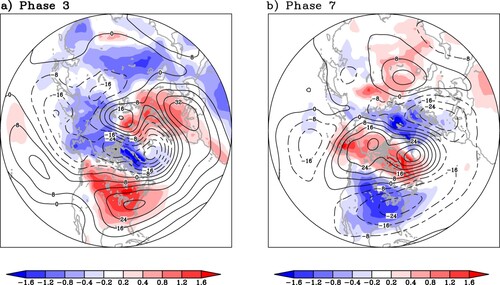
Fig. 4 Lagged composites of T2 m (in colour) and Z500 (in contour) anomalies 11–15 days after (a) MJO phase 3, and (b) MJO phase 7, during extended boreal winter season from November to March, based on the ERA-interim reanalysis over the 1981–2013 period. The contour interval is 8 m. Contours with negative values are dashed.