Figures & data
Table 1. List of oligonucleotides used in this study
Fig. 1 Effects of different concentrations of hygromycin B on the mycelial growth and conidial germination of Fusarium oxysporum.
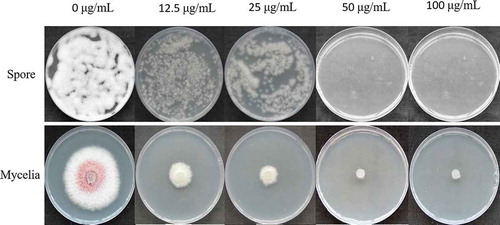
Fig. 2 Single-factor comparison of Agrobacterium tumefaciens-mediated transformation of Fusarium oxysporum. The factors include the co-cultivation duration (a), the co-cultivation temperature (b), the OD600 of A. tumefaciens (c), the conidium concentration of F. oxysporum (d), and the concentration of AS (e). The error bars represent the standard deviations of the repeats, and the different letters indicate significant differences between different treatments (P < 0.05)
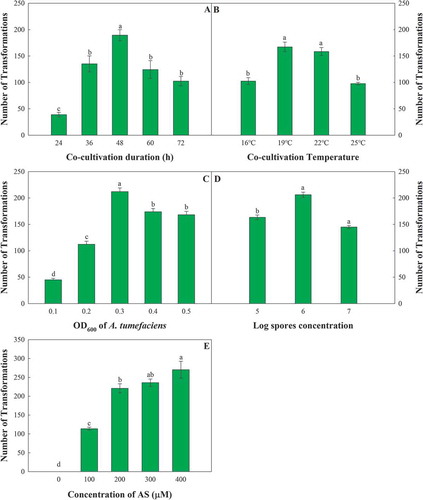
Fig. 3 Green fluorescent of the WT strain, HS2 (a, b), and a transformed strain, HS2-2483 (c, d), of Fusarium oxysporum. A and C represent the bright field; B and D represent the fluorescent field
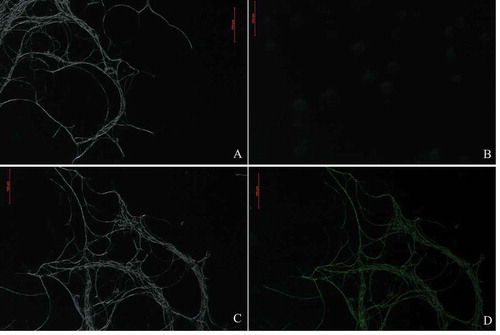
Fig. 4 Genetic stability of different transformants. Growth of WT strain HS2 and different transformants on PDA media without hygromycin (a). WT strain HS2 and related transformants after five generations without artificial selection on PDA media that contained 100 μg mL−1 hygromycin (b)
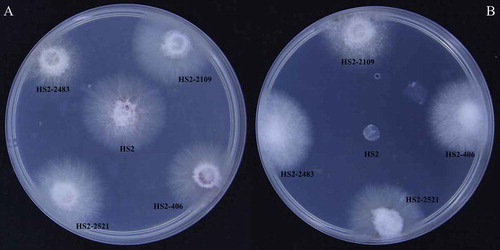
Table 2. Sporulation number of partial transformants per unit area
Fig. 5 Colony morphology of the WT strain, HS2 (a), and partial transformants (b–i). B to I represent transformant strains HS2-100, HS2-908, HS2-1017, HS2-511, HS2-527, HS2-532, HS2-711 and HS2-1015, respectively
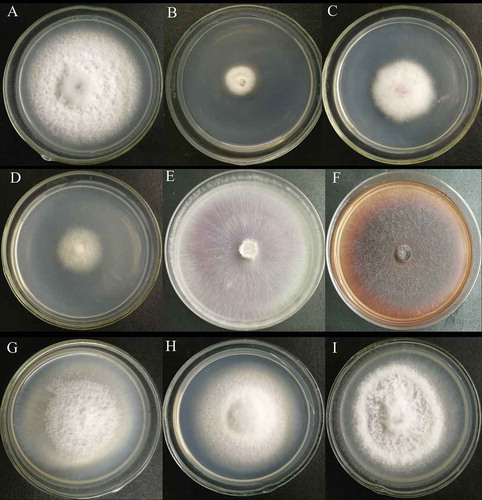
Table 3. Pathogenicity test of partial mutants
Fig. 6 Comparison of the length of crab apple radicles between the WT strain HS2 (a) and the pathogenicity-deficient transformants (b, c, d). B, C and D represent transformant strains HS2-2483, HS2-2521 and HS2-2109, respectively
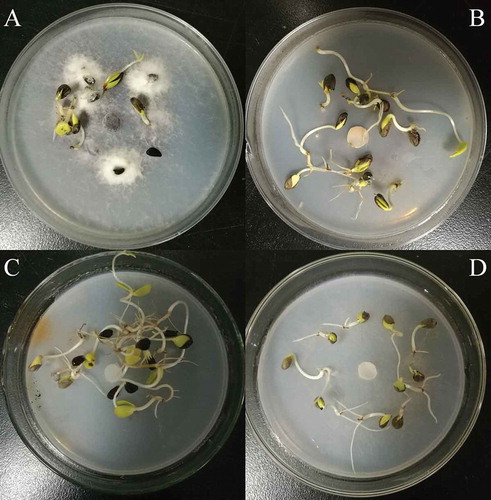
Fig. 7 Southern blot analyses of 8 different transformants of Fusarium oxysporum HS2 generated by ATMT. M represents the DNA marker; P represents the positive control of pCamhybgfp; Lanes 1–8 represent the transformant strains HS2-2483, HS2-2521, HS2-520, HS2-1106, HS2-2109, HS2-511, HS2-311 and HS2-2460, respectively; Lane WT represents the WT strain of F. oxysporum, HS2
Table 4. Analysis of identified genes possibly involved in the deficient pathogenicity of Fusarium oxysporum mutants
Fig. 8 RT-PCR analysis of the transcription of FOIG_07731, FOIG_00043, FOIG_09359, Fso1 and CEK26_00479. The β-actin gene was amplified and used as a control. Lane M represents the DNA marker; Lanes 2–6 represent different transformants mediated by ATMT; Lane 1 represents the WT strain of Fusarium oxysporum, HS2; Lane N represents the negative control
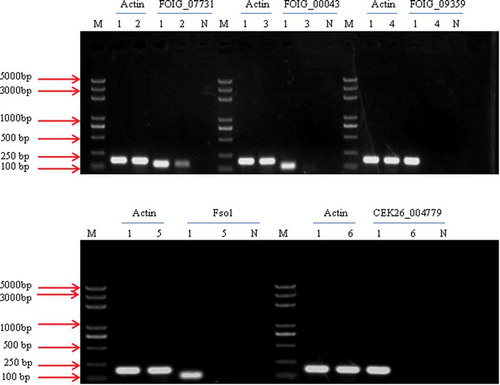
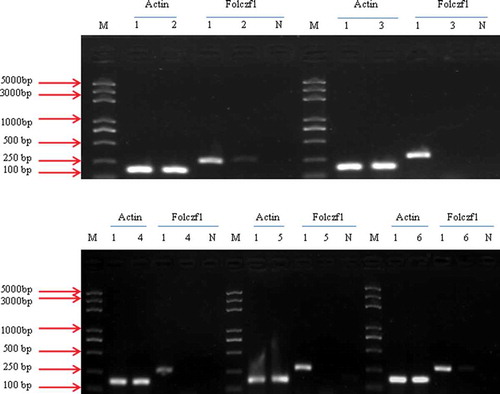
Fig. 9 RT-PCR analysis of the transcription of folczf1 in the different mutants. The β-actin gene was amplified and used as a control; Lanes 2 to 6 represent different transformants mediated by ATMT; Lane 1 represents the WT strain of Fusarium oxysporum, HS2; Lane N represents the negative control