
Figures & data
Table 1. Means and standard deviations for single items on student collegiality.
Table 2. Descriptive statistics, scale reliabilities and correlations.
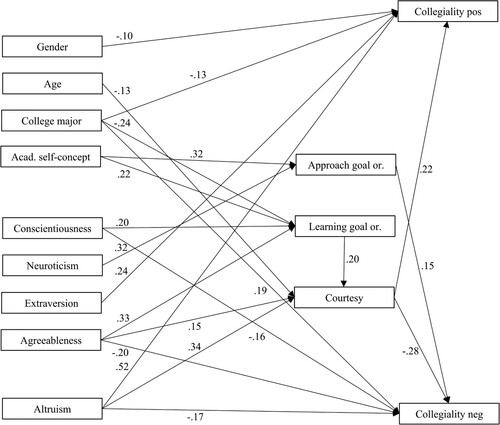
Figure 1. Parameter estimates of the tested model.
Note: The figure shows standardized path coefficients from the LISREL analysis. All lines represent significant paths, p < .05.
Data availability statement
Data and material are available on request.