
Figures & data
Figure 1. Leading estimated new cancer cases by sex in the United States, 2016.
*Adapted with permission from Siegel et al. (Citation2).
**Estimates are rounded to the nearest 10 and cases exclude basal cell and squamous cell skin cancers and in situ carcinoma except urinary bladder.
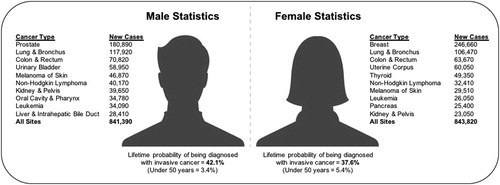
Table 1. American Cancer Society Guidelines on Nutrition and Physical Activity for Cancer Prevention.
Figure 2. Relationship of plasma glucose and ketone body levels to brain cancer management. The glucose and ketone (β-OHB) values are within normal physiological ranges under fasting conditions in humans. This is referred to as the zone of metabolic management. As blood glucose falls and ketones rise, an individual is predicted to reach the zone of metabolic management. Tumor progression is predicted to be slower within the metabolic target zone than outside of the zone. This can be tracked using the Glucose/Ketone Index.*
*Adapted with permission from Meidenbauer et al. (2015) [X].
![Figure 2. Relationship of plasma glucose and ketone body levels to brain cancer management. The glucose and ketone (β-OHB) values are within normal physiological ranges under fasting conditions in humans. This is referred to as the zone of metabolic management. As blood glucose falls and ketones rise, an individual is predicted to reach the zone of metabolic management. Tumor progression is predicted to be slower within the metabolic target zone than outside of the zone. This can be tracked using the Glucose/Ketone Index.**Adapted with permission from Meidenbauer et al. (2015) [X].](/cms/asset/01cdb30d-77f2-4307-8ebe-9dd081528f41/uacn_a_1500499_f0002_c.jpg)
Table 2. The Press-Pulse Therapeutic Strategy and Glucose/Ketone Index.*