
Figures & data
Table 1. Demographics and characteristics for consented patients (n = 45), all baseline patients (n = 40), and comparisons between those who did and did not complete the week 12 visit.
Figure 1. Mean ETS component changes between week 0 (baseline), week 6, and week 12 visits.
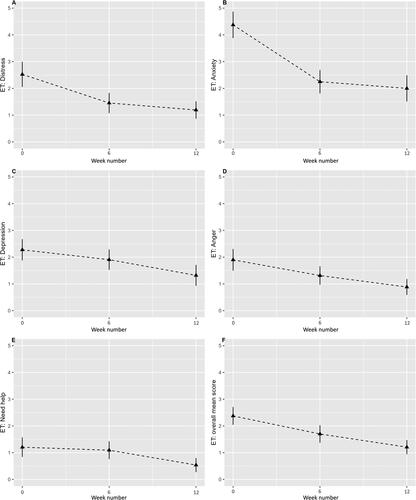
Figure 2. Mean MSAS component changes between week 0 (baseline), week 6, and week 12 visits.
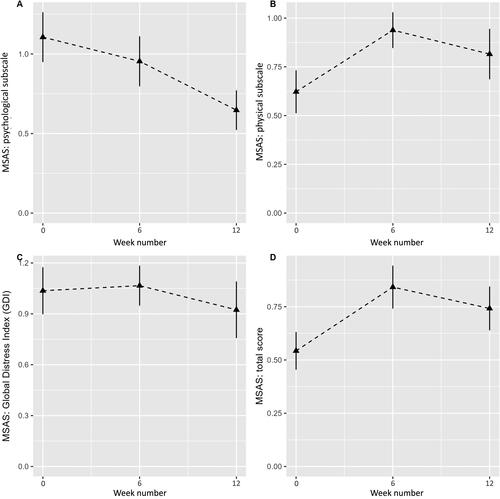
Table 2. Mean score comparisons from baseline to 6 and 12 weeks for the ETS and MSAS.
Table 3. Qualitative results: assorted first impressions.
Supplemental material
Supplemental Material
Download MS Word (401 KB)Data availability statement
The participants of this study did not give written consent for their data to be shared publicly, so due to the sensitive nature of the research supporting data is not available.