
Figures & data
Fig. 1 Histogram of the number of days between the end of the reference period and the date of the first release of the dependent variables, namely CPIAUCSL, GDPC1, INDPRO and PAYEMS.
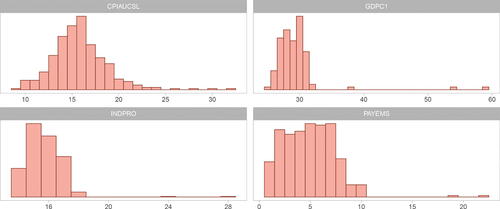
Fig. 2 Time series of the sentiment measures for all verbal tenses. The daily series is smoothed by taking a moving-average of 30 days and then subsampled at monthly frequencies. The gray areas denote the NBER recessionary periods.
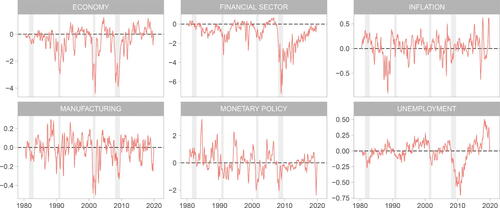
Fig. 3 Kernel density of the economic sentiment measures for all verbal tenses separately for periods of expansion (red) and recession (green) as defined by the NBER business cycle committee. The density is calculated on the monthly series.
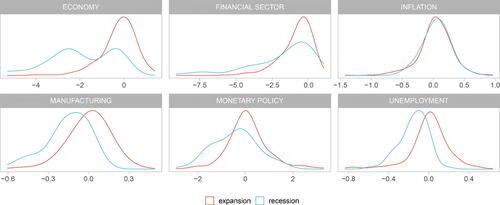
Fig. 4 Statistical significance of the sentiment measures based on the double lasso penalized regression in EquationEquation (1)(1)
(1) at each horizon h. The statistic reported is the p-value of the sentiment coefficient ηh corrected for multiple testing. The colors depend on the p-value for those variables that are significant at least at 10%: the darker the tile’s color, the smaller the p-value. The gray-shaded area corresponds to the reference period.
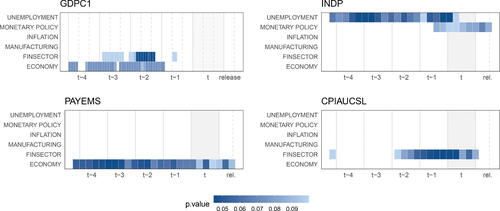
Fig. 5 Significance of the sentiment measures based on the double lasso penalized quantile regression at each horizon h for quantiles 0.1 (left column), 0.5 (center) and 0.9 (right). The colors depend on the p-value corrected for multiple testing for those variables that are significant at least at 10%: the darker the tile’s color, the smaller the p-value. The gray-shaded area corresponds to the reference period.
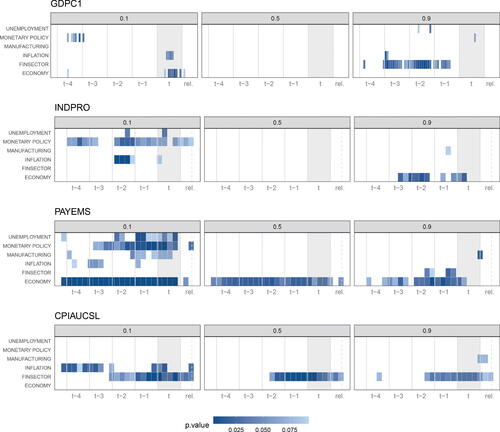
Table 1 One-sided p-values of the aSPA multi-horizon test proposed by Quaedvlieg (Citation2021).
Table 2 One-sided p-values of the aSPA multi-horizon test proposed by Quaedvlieg (Citation2021).