
Figures & data
Table 1. Clinicopathological characteristics of patients.
Figure 1. Distribution of SII, NLR, and GRIm-Score indices in rectal cancer patients with different clinical cancer staging, tumor lengths, and baseline CEA levels. (A) Boxplot showing the distribution of log-transformed SII values in rectal cancer patients with cancer staging T2-3 and T4. (B) Boxplot showing the distribution of log-transformed NLR values in rectal cancer patients with cancer staging T2-3 and T4. (C) A stacked column diagram showing the proportion of GRIm-Score ≥ 1 in rectal cancer patients with tumor length > 4 cm. (D) A stacked column diagram showing the proportion of GRIm-Score ≥ 1 in rectal cancer patients with serum CEA concentration > 5 ng/mL.
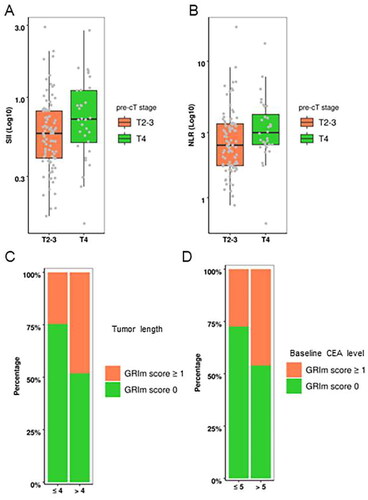
Table 2. The final logistic model to predict MRP.
Figure 2. Forest plot for the association between hematological and biochemical parameters and systemic inflammation indices and pCR (A) and MPR (B).
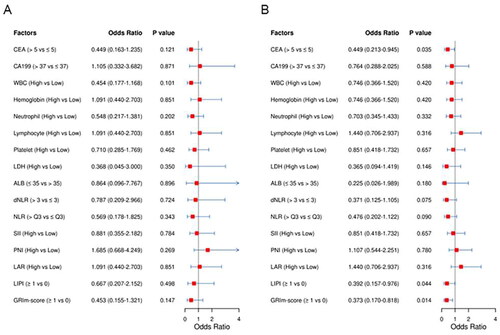
Figure 3. Kaplan-Meier survival curve for OS stratified by pre-cN stage, pre-cM stage, hemoglobin levels and DRS levels. (A) pre-cN stage. (B) pre-cM stage. (C) Hemoglobin. (D) DRS.
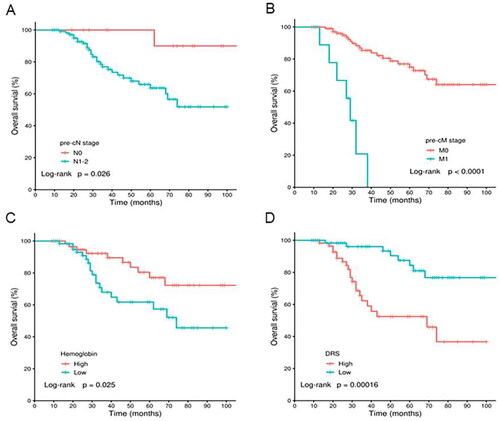
Table 3. The final prognostic model for OS.