
Figures & data
Table 1. List of published experimental data used for fitting the model for moisture ratio.
Table 2. Values for all the fitting parameters.
Figure 1. The fit of the model for moisture ratio and the corresponding experimental data is shown. A linear fit with R2 value and 95% prediction interval is also shown, the slope of the linear fit is 1.01.
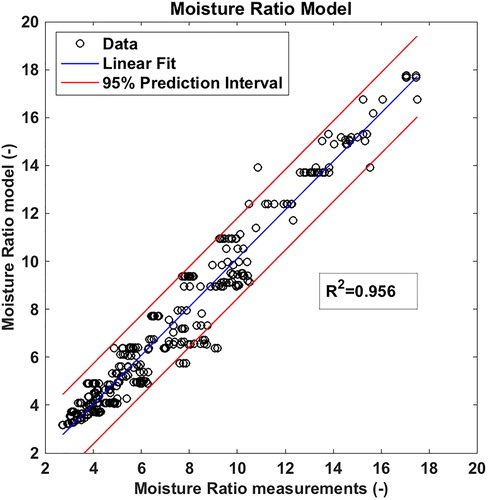
Figure 2. Model predictions for moisture ratio are shown together with corresponding experimental values (*) from.[Citation17,Citation23–25]
![Figure 2. Model predictions for moisture ratio are shown together with corresponding experimental values (*) from.[Citation17,Citation23–25]](/cms/asset/72ca8aba-b363-4604-8d81-6410bc67bea4/ldrt_a_1745825_f0002_c.jpg)
Figure 3. The fit of the model for air volume and the corresponding experimental data is shown. A linear fit with R2 value and 95% prediction interval is also shown, the slope of the linear fit is 0.97.
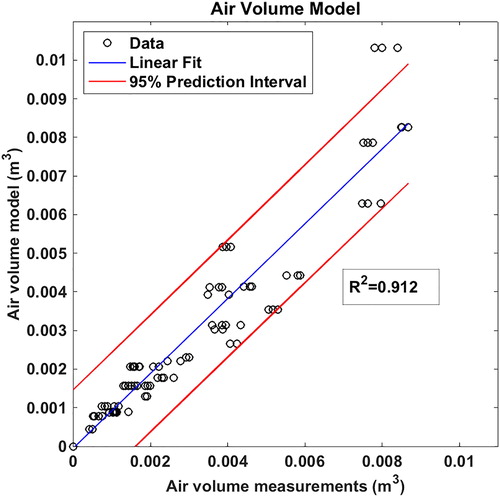
Figure 4. Model predictions for moisture ratio are shown together with corresponding experimental values (*) from Nilsson.[Citation23]
![Figure 4. Model predictions for moisture ratio are shown together with corresponding experimental values (*) from Nilsson.[Citation23]](/cms/asset/06b445ec-e369-4c0f-8e5e-985d9f017c66/ldrt_a_1745825_f0004_c.jpg)
Figure 5. The fit of the updated model for air volume and the corresponding experimental data is shown. A linear fit with R2 value and 95% prediction interval is also shown, the slope of the linear fit is 0.96.
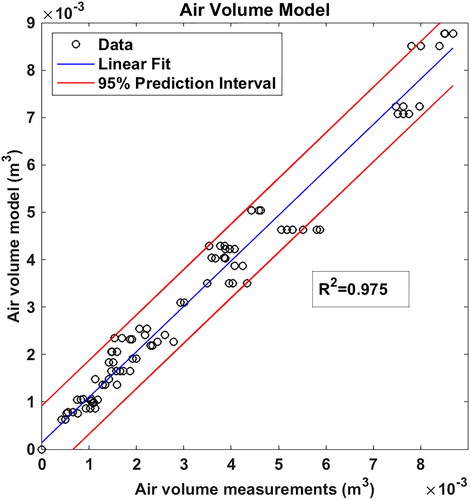
Figure 6. Updated model predictions for moisture ratio are shown together with corresponding experimental values (*) from Nilsson.[Citation23]
![Figure 6. Updated model predictions for moisture ratio are shown together with corresponding experimental values (*) from Nilsson.[Citation23]](/cms/asset/6ef2548c-a955-49a2-b539-877c0904e944/ldrt_a_1745825_f0006_c.jpg)