Figures & data
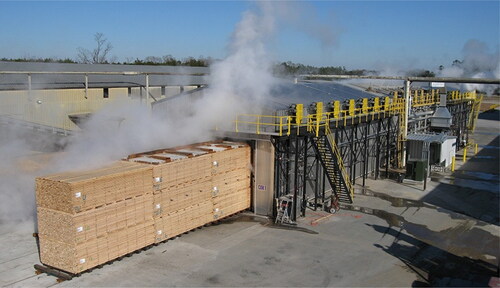
Figure 1. Wood drying kiln (a) and schematic end view of the kiln inside configuration (b).
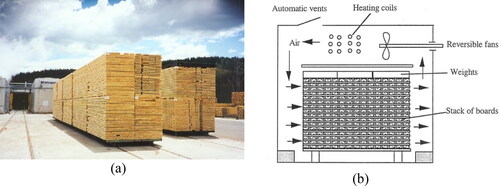
Figure 2. Moisture content distribution among boards toward the end of drying.[Citation1]
![Figure 2. Moisture content distribution among boards toward the end of drying.[Citation1]](/cms/asset/782b2f30-c2fb-4ec7-8ec4-66f212fbf917/ldrt_a_2205530_f0002_c.jpg)
Figure 3. Moisture content gradients along board thickness for sapwood (a) and heartwood (b) at different drying times.[Citation3]
![Figure 3. Moisture content gradients along board thickness for sapwood (a) and heartwood (b) at different drying times.[Citation3]](/cms/asset/3c492b6e-033b-4f6f-82ee-345898e5a276/ldrt_a_2205530_f0003_b.jpg)
Table 1. Common defects in wood drying.[Citation4–6]
Figure 4. Various possible modes of water transport in different types of wood adapted from Chen et al.[Citation15] Penvern et al.[Citation16] and Cocusse et al.[Citation17]
![Figure 4. Various possible modes of water transport in different types of wood adapted from Chen et al.[Citation15] Penvern et al.[Citation16] and Cocusse et al.[Citation17]](/cms/asset/8acf5abe-b499-4cd4-a92f-96a1bd3667de/ldrt_a_2205530_f0004_c.jpg)
Figure 5. Wood shrinkage as a function of moisture content in tangential direction (a) and longitudinal direction (b), adapted from Pang and Herritsch.[Citation25]
![Figure 5. Wood shrinkage as a function of moisture content in tangential direction (a) and longitudinal direction (b), adapted from Pang and Herritsch.[Citation25]](/cms/asset/c9d8c2d8-0588-4e19-8972-d1be1ee12e4f/ldrt_a_2205530_f0005_c.jpg)
Figure 6. Stress-free shrinkage in tangential direction (solid lines) and in radial direction (dotted lines) as a function of moisture content and temperature, adapted from Lazarescu et al.[Citation35]
![Figure 6. Stress-free shrinkage in tangential direction (solid lines) and in radial direction (dotted lines) as a function of moisture content and temperature, adapted from Lazarescu et al.[Citation35]](/cms/asset/e380869a-8bed-46a1-8d97-ad76298c089f/ldrt_a_2205530_f0006_b.jpg)
Figure 7. Drawing adapted from Hawley[Citation58] from early wood-water-relationships explaining the phenomenon of capillary pressure inside wood cells during drying.
![Figure 7. Drawing adapted from Hawley[Citation58] from early wood-water-relationships explaining the phenomenon of capillary pressure inside wood cells during drying.](/cms/asset/eb62870d-96bf-481c-a7ee-cb0d6210d856/ldrt_a_2205530_f0007_b.jpg)
Table 2. Equivalent pit radius and maximum capillary pressure for selected softwood species[Citation66] in comparison with the transverse tensile strength in green condition[Citation67].
Figure 8. The top two rows are, from left to right, microscope images of air dried, kiln dried and oven-dried (103 °C) Eucalyptus nitens samples adapted from Dickson.[Citation71] Colors in the bottom two rows show deformation visualization in which color change from green to magenta represents deformation levels, and white represents full cell collapse.
![Figure 8. The top two rows are, from left to right, microscope images of air dried, kiln dried and oven-dried (103 °C) Eucalyptus nitens samples adapted from Dickson.[Citation71] Colors in the bottom two rows show deformation visualization in which color change from green to magenta represents deformation levels, and white represents full cell collapse.](/cms/asset/2f13479c-f744-4e53-81af-297e2315def2/ldrt_a_2205530_f0008_c.jpg)
Figure 9. Cross sectional images of Eucalyptus nitens taken using a medical CT-scanner at different stages of drying. The grayscale from black to white is a measure of density, meaning that brighter zones represent higher MC.
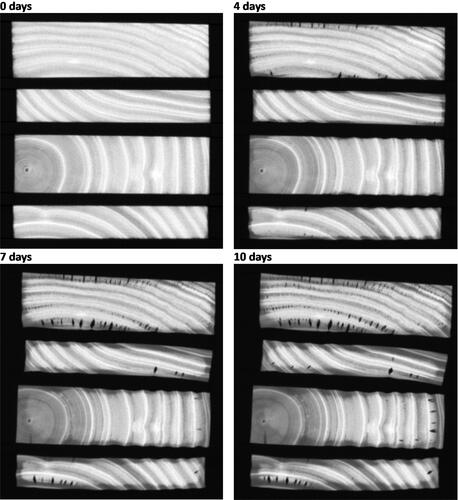
Figure 10. Example of MC profiles simulated with the percolation model.[Citation75] Drying proceeds from top-left to bottom-right. Blue areas represent free water, red areas represent dried cells, and black histograms represent average MC profiles.
![Figure 10. Example of MC profiles simulated with the percolation model.[Citation75] Drying proceeds from top-left to bottom-right. Blue areas represent free water, red areas represent dried cells, and black histograms represent average MC profiles.](/cms/asset/3f81b77d-38ad-403c-899b-4a2ac799905b/ldrt_a_2205530_f0010_c.jpg)
Table 3. Calculated RH, EMC and capillary pressure in equilibrium at 20 °C, with corresponding water potential, equivalent capillary R, and wet-bulb temperature.
Figure 11. CT-scanner cross section image of 25 mm thick radiata pine sample dried at 90/60 °C for 5 h.[Citation81] The CT-scanner image was treated digitally to show MC > FSP (blue) and MC < FSP (red) in a scale from 200% to 0%.
![Figure 11. CT-scanner cross section image of 25 mm thick radiata pine sample dried at 90/60 °C for 5 h.[Citation81] The CT-scanner image was treated digitally to show MC > FSP (blue) and MC < FSP (red) in a scale from 200% to 0%.](/cms/asset/f82b0ff2-0bb4-479f-9df5-1975bf294c4f/ldrt_a_2205530_f0011_c.jpg)
Figure 12. Schematic diagram of closed-loop heat recovery system, adapted from Aziz et al.[Citation119]
![Figure 12. Schematic diagram of closed-loop heat recovery system, adapted from Aziz et al.[Citation119]](/cms/asset/029c1222-a933-4d2a-af3b-2f7ac34eb47b/ldrt_a_2205530_f0012_b.jpg)
Figure 13. Example of a two-stage progressive kiln commonly used one decade ago in the lumber drying industry.[Citation31]
![Figure 13. Example of a two-stage progressive kiln commonly used one decade ago in the lumber drying industry.[Citation31]](/cms/asset/cdbc2d83-535c-4cc3-9065-22196167c9ab/ldrt_a_2205530_f0013_c.jpg)
Figure 14. Example of progressive kiln offered commercially by a local kiln manufacturer in New Zealand (www.windsorengineering.co.nz/drying/kilns/).