
Figures & data
Table 1. RNA aptamers and controls selected for molecular docking using HADDOCK.
Table 2. Twenty (20) homologous templates identified for the EBOV NP protein sequence using Phyre2 web server.
Figure 1. Superimposition between modeled EBOV NP and template proteins (c6ehmB, c4qb0A and c4ypiA) using PYMOL. The EBOV NP is depicted as cartoon with different chains in green color, while the templates (c6ehmB is depicted as a single chain in light blue, c4qb0A in purple and c4ypiA in yellow colors). Panel A) Structural alignment of c6ehmB to EBOV NP, Panel B) Structural alignment of c4qb0A to EBOV NP and Panel C) Structural alignment of c4ypiA to the EBOV NP. Superimposition of the templates produced RMSDs of 0.637 (318 to 318 atoms), 0.068 (75 to 75 atoms) and 0.678 (266 to 266 atoms), respectively. Also, 390, 91 and 346 residues of c6ehmB, c4qb0A and c4ypiA were match-aligned to 744 residues of the refined EBOV NP, which produced a match-alignment scores of 1963.000, 502.000 and 1749.000, respectively.
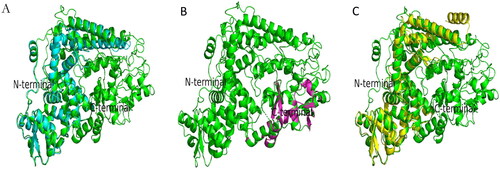
Table 3. HADDOCK binding scores and energetic contributors for the three aptamers and an experimental control.
Table 4. Hydrogen bonds, salt-bridges and hydrophobic interactions of the EBOV NP amino acids from PLIP. .
Figure 2. Trajectory analysis of the five EBOV NP-aptamer complexes over the 200 ns simulation period. A: root mean square deviation (RMSD) and B: radius of gyration (GyR) over 200 ns simulation time.
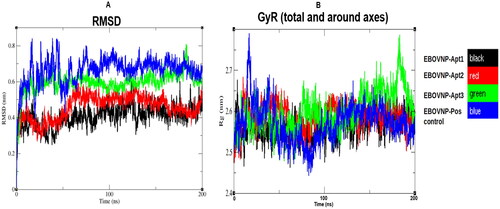
Figure 3. Trajectory analysis of the five EBOV NP-aptamer complexes over 100–180 ns simulation period. (A) Root mean square fluctuations (RMSF) with black rings indicating amino acids with higher fluctuations between regions 1 to 5 (R1–R5). (B) EBOV NP structure (green) with fluctuating amino acids presented as sticks colored in brown (N terminal residues 1–15), orange (121–129), cyan (258–269), magenta (362–379) and purple (C terminal residues 475–500). (C) EBOV NP structure/model analyzed by psipred web server. The fluctuating residues fell within the coiled regions (R1–R5).
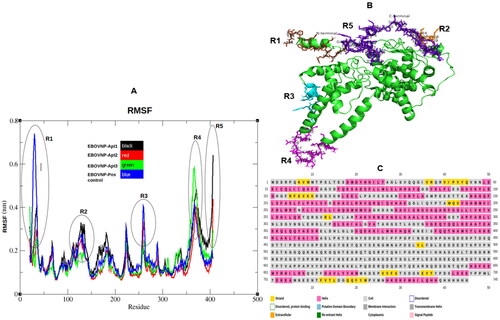
Figure 4. Hydrogen bond analysis of the five EBOV NP-aptamer complexes over the observed stable simulation time (100–180 ns). Black: EBOV NP-Apt1, red: EBOV NP-Apt2, green: EBOV NP-Apt3 and blue: positive control, respectively.
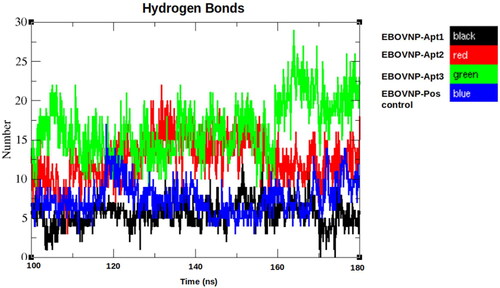
Table 5. Non-bonded interactions energies (Coulomb and Lennard-Jones) between the aptamers and the EBOV NP.
Table 6. MMPBSA analysis of EBOV NP-aptamer complex MD simulation, at 150–180 ns (1500–1800 frames).
Figure 5. MST fractions bound of A: aptamer 1, B: aptamer 2 and C: aptamer 3. Tech: technical repeats with baseline corrections.
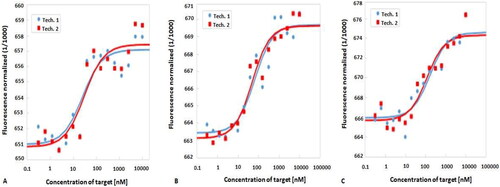
Table 7. Binding affinities and binding constants of the three aptamers with EBOV NP using MST.