
Figures & data
Figure 1. Three-dimensional structure validation of P. falciparum and human Hsp90 NTD. The refined 3D NTD structures of the (A) PfGrp94, (B) HsHsp90α, (C) Hsp90 β, (D)HsGrp94, (E) HsTRAP-1 and their respective Ramachandran plot analysis of the Psi and Phi angles. The 3D structures were visualised using ChimeraX v1.5.
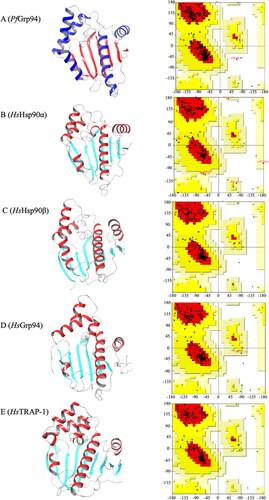
Figure 2. Schematic representation of the screening workflow of ATP-mimicking compounds targeting PfGrp94. The ZINC data base was probed for Hsp90 NTD-binding compounds and screened for selectivity towards PfGrp94 binding using BioSolveIT software. The red box for Compound S and Compound Z indicates the structural changes (compared to Compound 653) that was made to increase selectivity to PfGrp94.
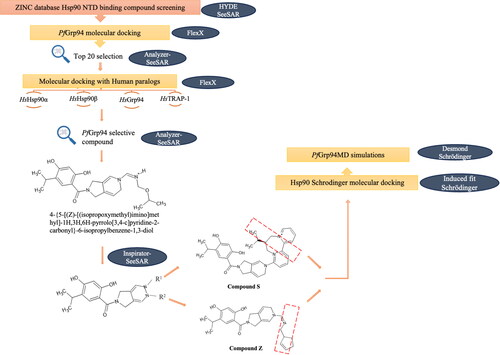
Figure 3. Schematic diagrams of Hsp90 NTDs docked with Compound S and Z. (A) represents PfGrp94 in complex with Compound Z and (B) represents PfGrp94 in complex with Compound S. The surface display of the binding cavity showing the orientation of the compounds when bound to the PfGrp94, a zoomed in 3D representation of the compounds interacting with PfGrp94 and a 2D representation of the bond types and interacting residues. The cut-off was set at 4 Å for the best docked stabilizing pose of the complex. The predicted docking poses were generated using Schrödinger Maestro 2022.1.
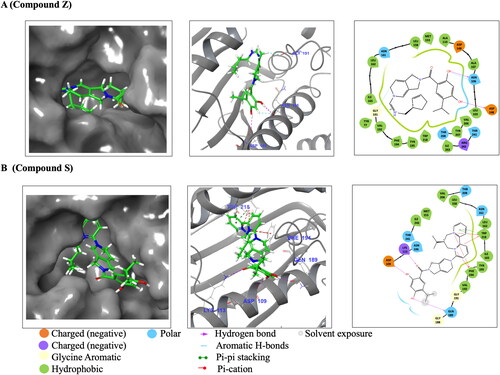
Table 1. Molecular docking analysis of PfGrp94 interacting residues with compounds within 4 Å.
Table 2. Docking scores for Hsp90 NTD homologues in complex with ATP, Compound S and Compound Z.
Table 3. Comparative ADME/T properties of the compounds S and Compound Z.
Table 4. Simulation quality analysis of the three systems simulated over a simulation period of 250 ns.
Figure 4. RMSD, RMSF and Radius of Gyration plot during MD simulation. (A)The Rg of Cα atoms (B) The RMSD plot of PfGrp94 Cα atoms and over a simulation period of 250 ns (C) NTD-PfGrp94 RMSF of apo and in complex with Compound S or Compound Z (D) The Ligand RMSD graph showing the stability of the compounds with respect to the PfGrp94-binding site (E) Represents the evolution of the compounds during the simulation in a superimposed image. The initial frames are coloured deep shade of blue and the final frame are coloured deep shade of red. Furthermore, a schematic of detailed ligand atom interactions with the protein residues that occur more than 30% of the simulation period within the active site. The plots were sketched using GraphPad prism v10.0.2 and images were generated from Maestro v13.1.
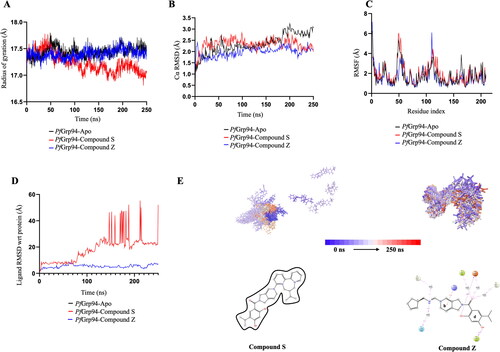
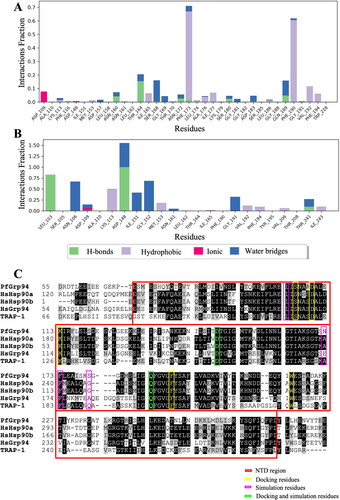
Figure 5. Analysis of the type and number of contacts between the compounds and PfGrp94. (A) compound S and (B) compound Z as monitored throughout the simulation. The images were generated from the simulation interaction diagram algorithm in Maestro v13.1 (C) Comparison of the human (HsHsp90α, HsHsp90β, HsGrp94, and HsTRAP-1) and plasmodial Hsp90 (PfGrp94) NTD sequence alignment. Conserved residues are shaded in black and similar residues are shaded grey and non-conserved regions are in white. The NTD region of PfGrp94 is highlighted with the red box. The picture was generated by BioEdit v7.2.5.
Supplemental Material
Download PDF (5.9 MB)Data availability statement
All data presented in the current study are contained within the manuscript/Supplementary Materials and accessible from the corresponding author including simulation videos upon request.