
Figures & data
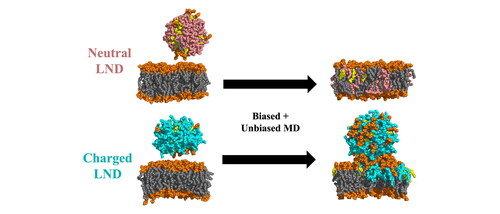
Figure 1. Scheme of the simulation protocol. Membrane headgroups are depicted in orange (PC), light orange (PE), purple (PG) and green (PS), all lipid tails in grey, CHL in yellow, ILs in pink (deprotonated, neutral) and cyan (protonated, positively charged).
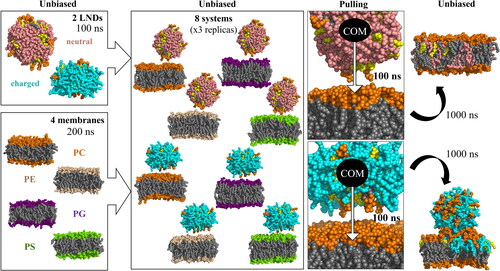
Figure 2. Outer and inner views of (A) deprotonated and (B) protonated LNDs (ILs in pink (deprotonated) and cyan (protonated), CHL in yellow, helper DSPC lipid headgroup in orange, tails in grey; (C) Structure of IL ALC-0315 (A3D) represented in uncharged (deprotonated) form; (D) Density profile of a starting structure of a deprotonated IL LND and POPC membrane, with mass densities of the headgroup shown in orange, tail in grey, CHL in yellow, IL in pink and water in light blue. The system was divided into four sections (above and below membrane, upper and lower leaflet) based on the position of the headgroup density peak; (E) Representation of parts of the system: LND (containing charged ILs) interacting with upper leaflet of a membrane forming a lipid spike connected to the membrane via the interface.
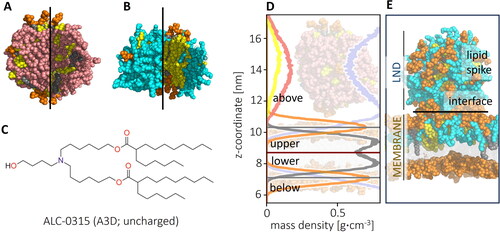
Figure 3. Time evolution of lateral pressure profiles of an uncharged (top) and charged (bottom) system with POPC lipid and respective simulation snapshots. Negative values in the pressure profiles correspond to attractive forces, whereas positive peaks correspond to repulsive regions. The time values indicate the time from the beginning of the pulling simulation. Therefore, 100 ns corresponds to the end of the pulling simulation, after which an unbiased simulation was run.
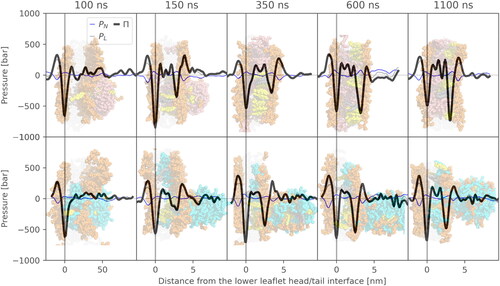
Figure 4. Fraction of IL content above the membrane and in the lower leaflet during simulations averaged over three replicas. The solid lines correspond to systems with deprotonated IL, whereas the dotted lines correspond to the protonated IL. The grey vertical line indicates the end of pulling.
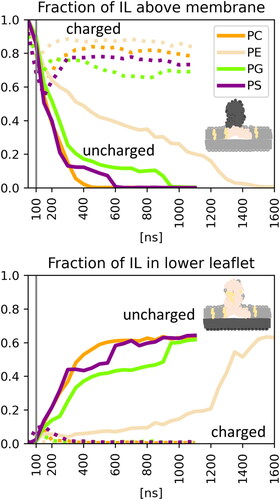
Figure 5. Ratio of different lipids above the membrane (upper panel) and within the two membrane leaflets (middle and lower panel) averaged over three replicas. ML (grey) denotes the membrane lipid content, CHL (yellow), A3D (pink) the deprotonated and A3P (cyan) the protonated form of the IL.
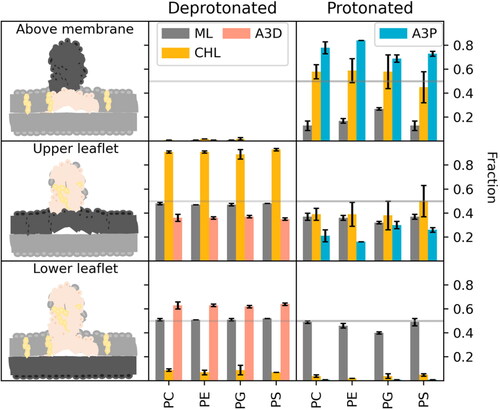
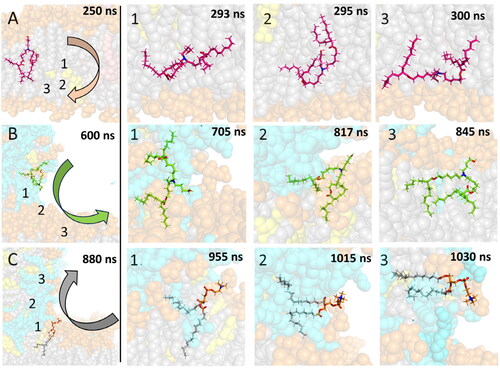
Figure 6. Mechanism of diffusion of (A) uncharged IL (A3D) from the upper to lower leaflet, (B) charged IL (A3P) from an LND-induced spike to the membrane, (C) POPC from the membrane to the spike. The lipid of interest is shown by sticks, other molecules as balls. POPC headgroups are shown in orange, POPC tails in grey, charged IL in cyan/green, uncharged IL in light/bright pink, nitrogens of the lipid of interest in blue and oxygens of the lipid of interest in red. Numbers in the figures of the left column correspond to the position of ionizable nitrogen/POPC phosphorus atoms of the steps on the right.
Supplemental Material
Download Zip (7.3 MB)Data availability statement
The starting structures and topologies as well as trajectories, simulation details and scripts are available in the online Zenodo repository (https://doi.org/10.5281/zenodo.10679359).