Figures & data
Table 1. Fit statistics for latent class analysis of the propensity component.
Table 2. Fit statistics for latent class analysis of the situation component.
Figure 1. Elbow-Plot showing the parsimony and goodness-of-fit for propensity models.
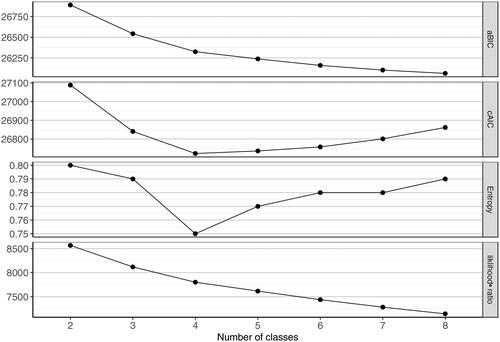
Figure 2. Posterior probability of manifest variable responses across classes for propensity. From left to right profiles are labelled Moderate propensity, Cognitive susceptibility, High propensity, Low propensity.
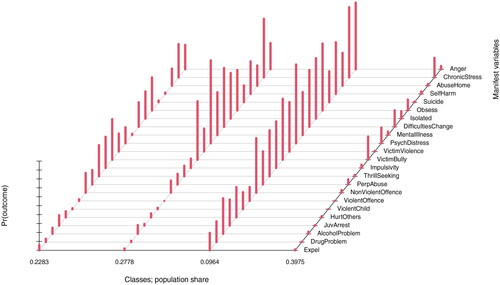
Figure 3. Elbow-Plot showing the parsimony and goodness-of-fit for situation models with varying number of classes.
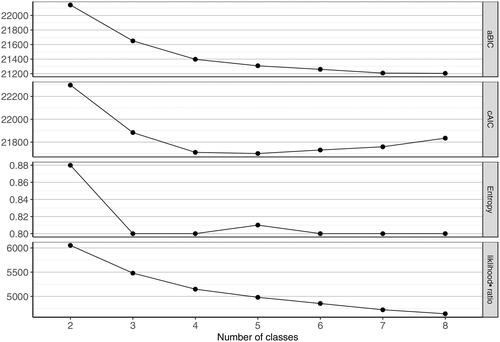
Figure 4. Posterior probability of manifest variable responses across classes for situation. From left to right profiles are labelled Interpersonal stress, Low stress, High stress, Proximate crisis.
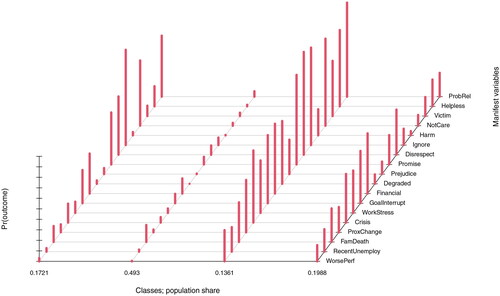
Figure 5. Elbow-Plot showing the parsimony and goodness-of-fit for exposure models with varying number of classes.
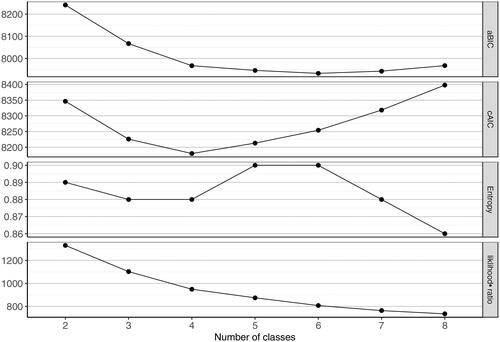
Table 3. Fit statistics for latent class analysis of the exposure component.
Figure 6. Posterior probability of manifest variable responses across classes for exposure. From left to right profiles are labelled High exposure to radicalizing moral norms, High contact/attachment, Moderate contact/attachment, Low exposure.
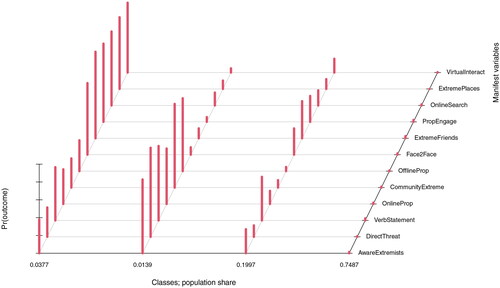
Table 4. Chi-Square tests examining age and sex differences in risk profile membership.
Figure 7. Interaction of high propensity and proximate crisis on violent extremist intentions.
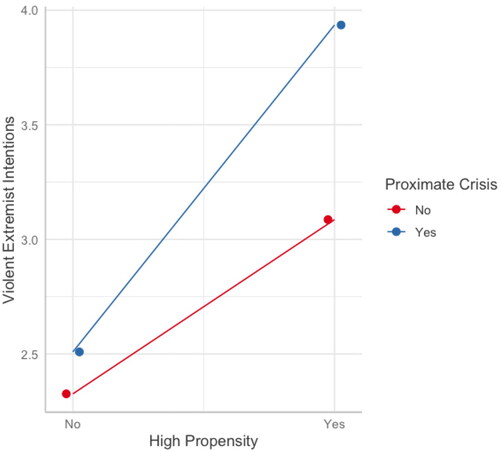
Figure 8. Interaction of high propensity and high contact/attachment on violent extremist intentions.
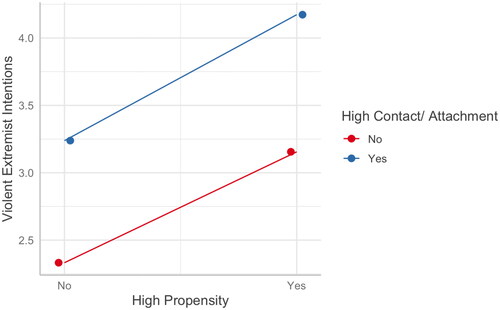
Figure 9. Interaction of proximate crisis and high contact/attachment on violent extremist intentions.
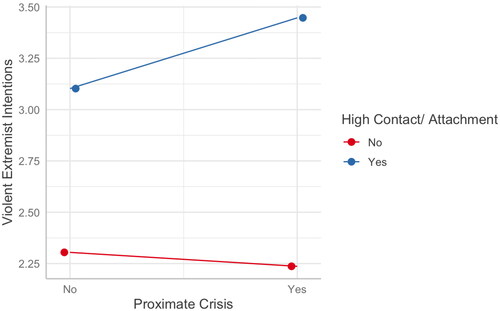
Figure 10. Interaction of high propensity and low situational stress on violent extremist intentions.
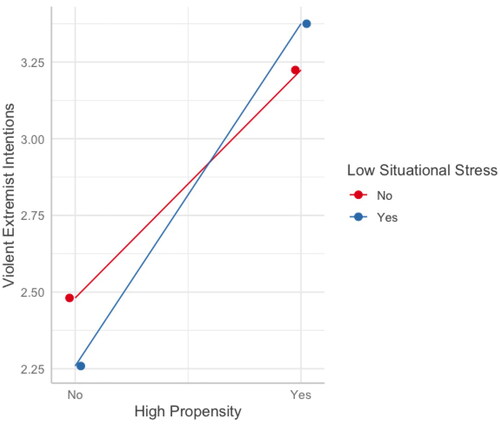
Figure 11. Interaction of high propensity and low exposure on violent extremist intentions.
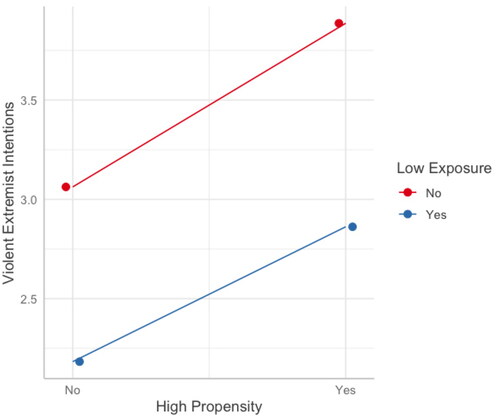
Figure 12. Interaction of proximate crisis and low propensity on violent extremist intentions.
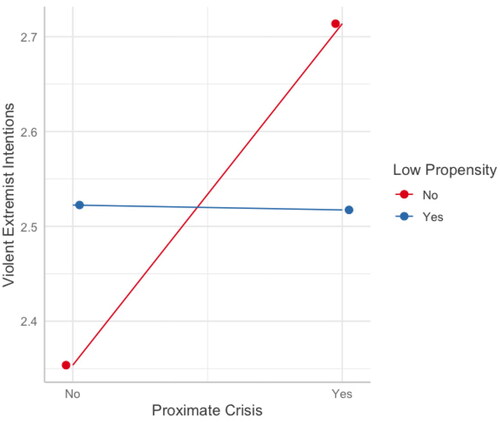
Figure 13. Interaction of proximate crisis and low exposure on violent extremist intentions.
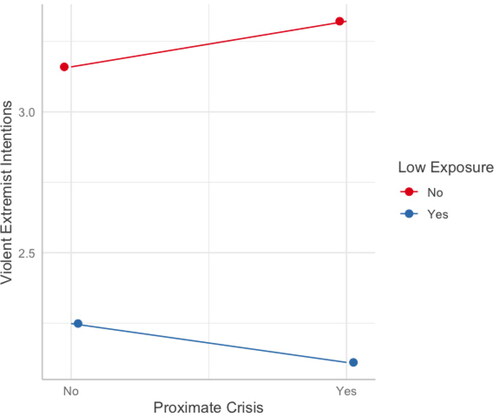
Figure 14. Interaction of high contact/attachment and low propensity on violent extremist intentions.
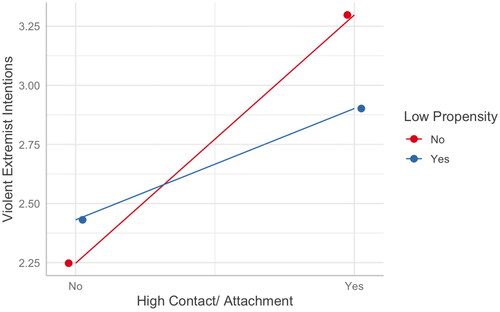
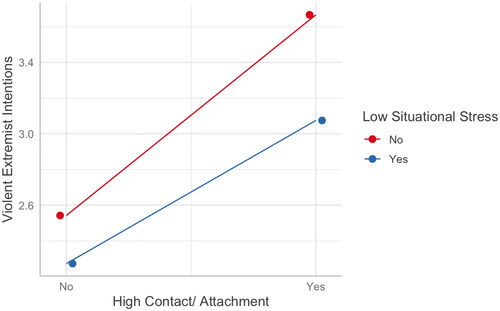
Figure 15. Interaction of high contact/attachment and low situational stress on violent extremist intentions.