
Figures & data
Table 1. Psychometric properties and factor loadings of the PG-12-R.
Figure 1. Comparison between eigenvalues from principal component analysis of PG-12-R and eigenvalues from parallel analysis from random data (median of 1000 replications).
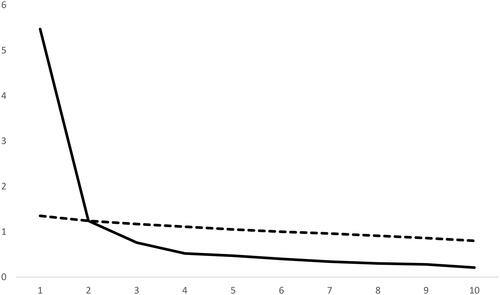
Table 2. Bivariate Pearson’s correlations between PG-12-R symptom score (sum of 10 items) and related constructs.
Supplemental material
Supplemental Material
Download MS Word (33.8 KB)Data availability statement
The data that support the findings of this study are available from the corresponding author, [VS], upon reasonable request.