
Figures & data
Table 1. Motives of the exclusion of cases and controls from the study.
Figure 1. Flow of the cases and the controls throughout the two stages of the project.
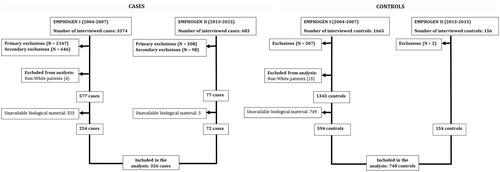
Table 2. Description of the cases and controls included in the study.
Table 3. Prevalence of the studied genotypes and Hardy–Weinberg equilibrium test.
Table 4. Odds ratios (OR) for UGIH stratified by patients’ genotype and NSAID (any NSAID, aspirin, non-aspirin) exposure and their interaction represented by synergism index (S) and relative excess risk due to interaction (RERI).
Data availability statement
The data that support the findings of this study are available in [FigShare] at [10.6084/m9.figshare.11822223].