
Figures & data
Figure 1. Participant inclusion criteria flow diagram.
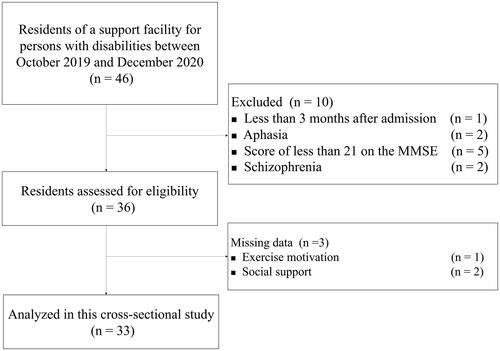
Table 1. Participant demographic characteristics and injury characteristics (n = 33).
Table 2. Descriptive values for study variables (n = 33).
Table 3. Correlations of study variables.
Table 4. Hierarchical regression analysis for predicting autonomous motivation.
Table 5. Hierarchical regression analysis for predicting controlled motivation.
Data availability statement
The data that support are openly available in figshare at http://doi.org/10.6084/m9.figshare.16620454.