
Figures & data
Figure 1. Flow chart for enrollment of the retrospective cohort study.
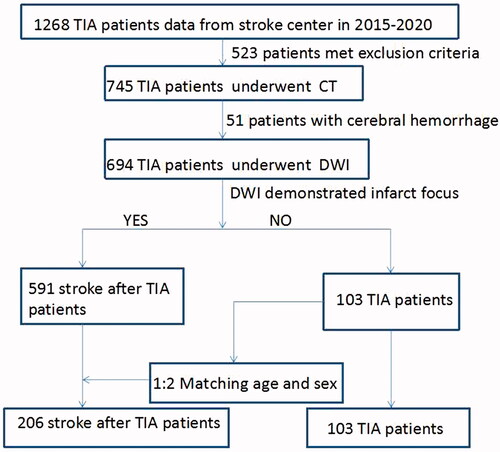
Table 1. The clinical characteristics of the study samples.
Figure 2. (A–F) Correlation analysis about oxidative stress and inflammatory markers.
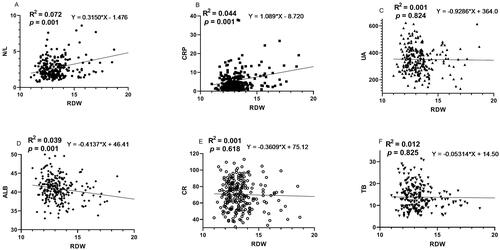
Table 2. Risk factors for stroke using multiple logistic regression.
Figure 3. (A–D) Distribution characteristics of RDW value in TIA and stroke group, age, stroke onset time and stroke aetiology.
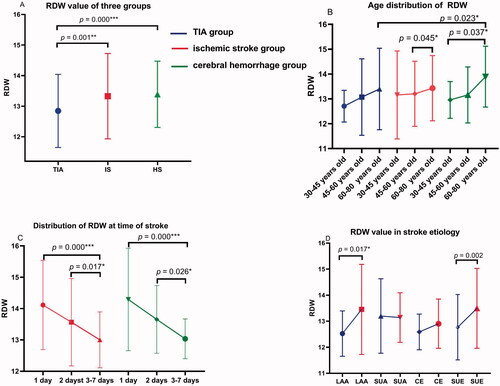
Table 3. Distribution characteristics of RDW value in age, stroke onset time and stroke aetiology.
Figure 4. The ROC curve analysis of admission RDW for predicting the stroke after TIA.
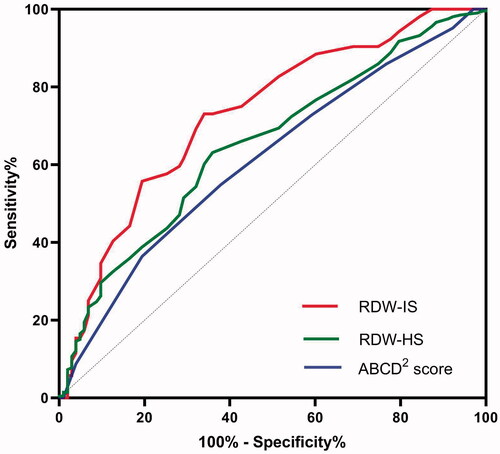
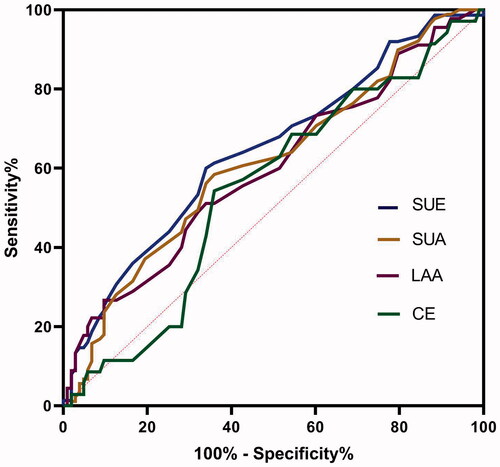
Figure 5. The ROC curve analysis of admission RDW for predicting the stroke aetiology.
Supplemental Material
Download MS Word (20.5 KB)Data availability statement
The data that support the findings of this study are available on request from the corresponding author. The data are not publicly available due to privacy or ethical restrictions.