
Figures & data
Table 1. Demographic and clinical characteristics of the population of study.
Figure 1. Estimated glomerular filtration rate (eGFR) values according to the presence of rs710218 (A), rs841848 (B) and rs3813008 (C) variants, and albumin-to-creatinine ratios (ACR) distributed by rs3758947 genotypes (D) in patients with diabetic nephropathy. Manhattan plots show the p-value for the association of all the SNPs studied regarding eGFR (E) and ACR (F). *p < 0.05.
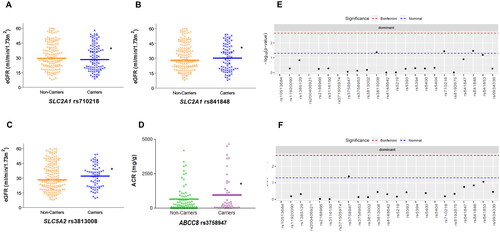
Figure 2. Distribution of common carotid intima media thickness (CCIMT) values according to different genotypes of ABCC8 in patients with diabetic nephropathy. The Manhattan plot shows the p-value for the association of all the SNPs studied. *p < 0.05.
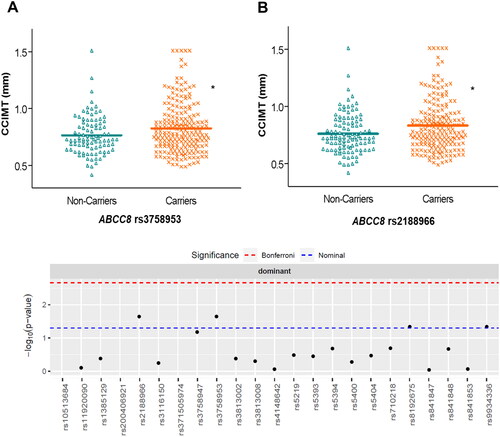
Table 2. Variables of interest in patients of diabetic nephropathy experiencing or not cardiovascular events.
Figure 3. Kaplan–Meier curves depicting cardiovascular event-free survival in patients with diabetic nephropathy carrying the SLC2A2 rs8192675 (A) or SLC5A2 rs9924771 (B) polymorphisms.
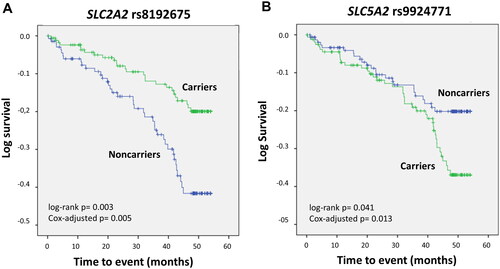
Table 3. Cox regression analysis showing the effect of rs8192675 and rs9924771 on cardiovascular event-free survival in diabetic nephropathy patients.
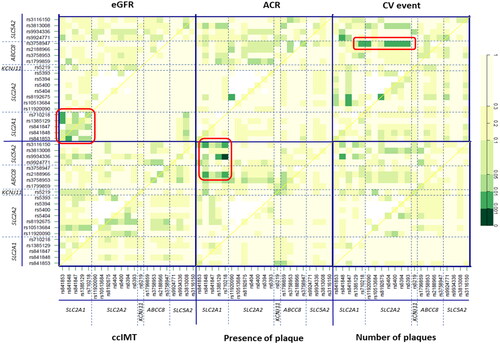
Figure 4. Effect of interactions between SNPs in glucose homeostasis genes on several clinical phenotypes in CKD patients. Significant hits discussed in the text are highlighted in red. The diagonal line contains the P values from likelihood ratio test for the crude effect of each SNP, which are sorted by their genomic position. The upper triangle in the matrix contains the P values for the interaction (epistasis) log-likelihood ratio test. Finally, the lower triangle contains the P values from likelihood ratio test comparing the two-SNP additive likelihood to the best of the single-SNP models. eGFR: estimated glomerular filtration rate (ml/min/1.73 m2); ACR: albumin-to-creatinine ratio (mg/g); CV: cardiovascular; CCIMT: common carotid intima media thickness.
Supplemental Material
Download TIFF Image (1.5 MB)Supplemental Material
Download TIFF Image (1.2 MB)Supplemental Material
Download TIFF Image (1.2 MB)Supplemental Material
Download MS Word (67.6 KB)Data availability statement
The datasets underlying this article can be found at Figshare with DOI 10.6084/m9.figshare.20936788