
Figures & data
Figure 1. Expression of circDENND4C and miR-200b/c and its correlation in EOC tissue and serum specimens. (a–c) qRT-PCR was performed to determine the relative expression of circDENND4C and miR-200b/c in clinical tissue specimens. (d–f) qRT-PCR was performed to measure the relative expression of circDENND4C and miR-200b/c in clinical serum specimens. (g–j) The correlation between circDENND4C and miR-200b/c expression in EOC tissue and serum specimens. *** vs normal tissue/serum, p < 0.001; ### vs benign tissue/serum, p < 0.001.
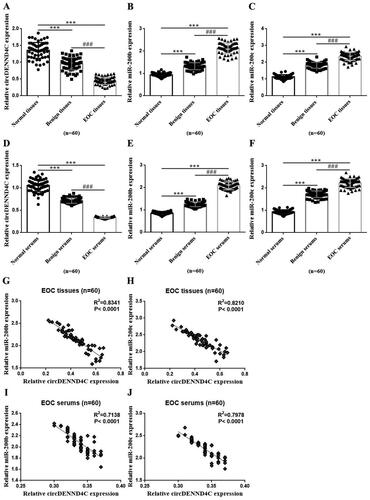
Figure 2. CA125 and HE4 expressions and the correlation between circDENND4C and CA125/HE4 in EOC serum specimens. (a,b) Serum CA125 and HE4 levels in clinical serum specimens. (c,d) The correlation between circDENND4C and CA125/HE4 expression in EOC serum specimens was determined using Spearman correlation coefficient analysis. *** vs normal serum, p < 0.001; ### vs benign serum, p < 0.001.
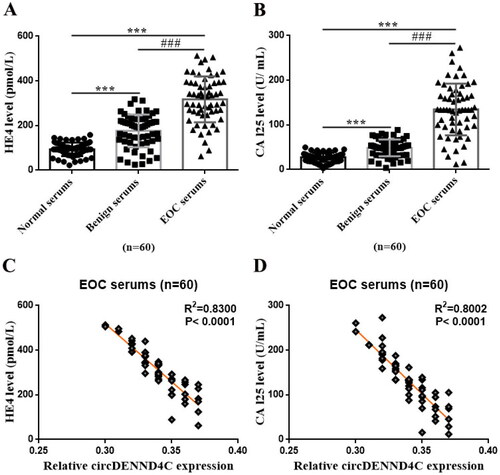
Figure 3. Serum circDENND4C expression differs between patients with benign ovarian tumors/EOC and healthy women. (a,b) ROC analysis shows the sensitivity and specificity of serum circDENND4C in distinguishing patients with benign ovarian tumors/EOC from healthy women. ROC: receiver operating characteristic; AUC: area under the curve.
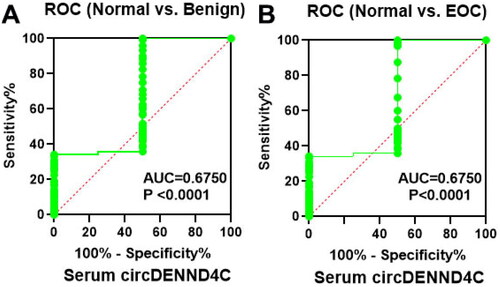
Table 1. The expression of circDENND4C in tissues/serums of EOC patients was related to the disease progression.
Table 2. Analysis of auxiliary diagnostic value of serum circDENND4C in EOC.
Table 3. Analysis of auxiliary diagnostic results of serum circDENND4C, CA125 and HE4 for epithelial ovarian cancer.
Table 4. The diagnostic performance comparison between serum circDENND4C and CA125/HE4 for epithelial ovarian cancer.
Figure 4. circDENND4C expression and the role on miR-200b/c expression in EOC cells. (a) circDENND4C expression in EOC cells was assessed using qRT-PCR. * vs HOSEPiCs, p < 0.05. (b) EOC cells overexpressing circDENND4C were established via the transfection of a pcDNA-based circDENND4C overexpression vector. (c,d) Overexpression of circDENND4C significantly downregulated miR-200b/c expression in EOC cells. ** vs pcDNA, p < 0.01.
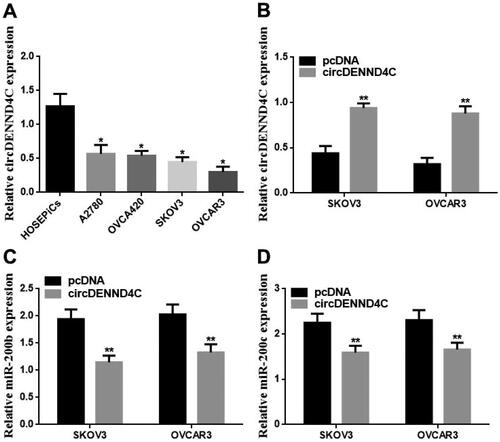
Figure 5. Overexpression of circDENND4C inhibited EOC cell proliferation by regulating the expression of miR-200b/c. (a–d) A CCK-8 proliferation assay was performed to measure the OD value of SKOV3 and OVCAR3 cells at 450 nm and 24 h, 48 h, and 72 h following the transfection of different constructs. * vs pcDNA, p < 0.05; # vs circDENND4C, p < 0.05; $vs NC mimic, p < 0.05; % vs miR-200b/c mimic, p < 0.05.
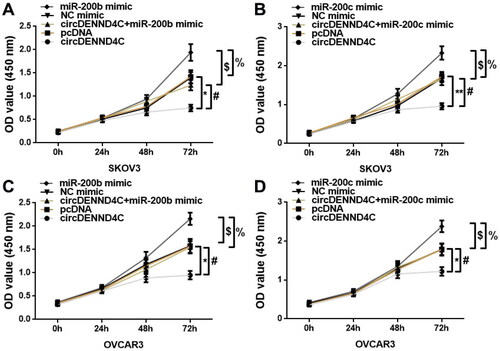
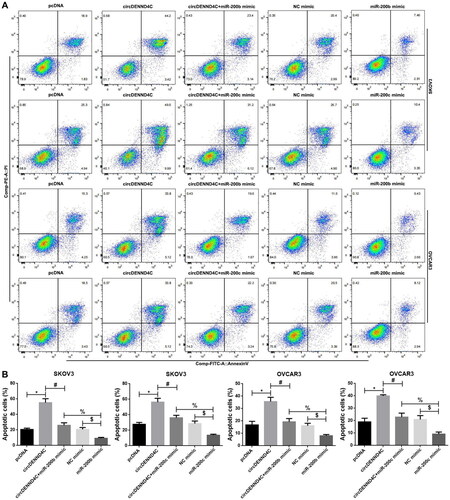
Figure 6. Overexpression of circDENND4C promoted cell apoptosis by regulating the expression of miR-200b/c. (a) Representative images of flow cytometry-based apoptosis analysis. (b) Histogram of results from the flow cytometry apoptosis experiment. * vs pcDNA, p < 0.05; # vs circDENND4C, p < 0.05; $vs NC mimic, p < 0.05; % vs miR-200b/c mimic, p < 0.05.
Data availability statement
All the data produced or analyzed in the present work are available from the corresponding author on reasonable request.