
Figures & data
Table 1. Patients characteristics.
Figure 1. Flow diagram of study population. A total of 2488 critically ill patients who received renal replacement therapy between January 1, 2009 and December 31, 2018 were screened. In total, 999 patients who were diagnosed to have sepsis defined by the Sepsis-3 criteria and dialysis-requiring SA-AKI were enrolled in this study. ICU: intensive care unit; SA-AKI: sepsis-associated acute kidney injury; qSOFA: quick SOFA score; SOFA: sequential organ failure assessment score.
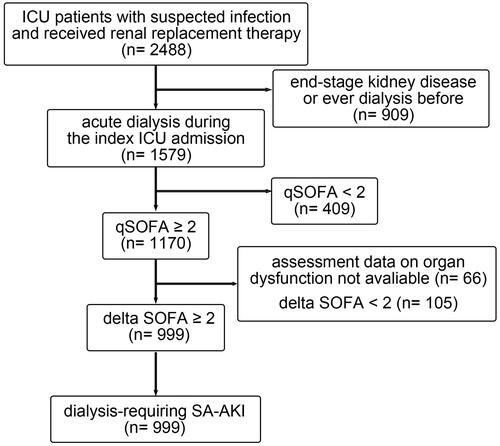
Figure 2. Baseline characteristics across the three phenotypic clusters of patients. The Manhattan plot of the standardized differences in the baseline clinical characteristics across the three clusters revealed by the 23 parameters upon initializing renal replacement therapy. The dashed vertical lines represent the absolute standardized difference of 0.3. Key features (having an absolute standardised difference of ≥0.3) for each cluster are marked in red. DM: diabetes mellitus; HTN: hypertension; CAD: coronary artery disease; adv_CHF: advanced heart failure: defined by New York Heart Association functional class III or IV; Charlson: Charlson Comorbidity Index; baseGFR: baseline estimated glomerular filtration rate; CVS: cardiovascular surgery; TPN: total parenteral nutrition; CPR: cardiopulmonary resuscitation; ECMO: extracorporeal membrane oxygenation; ≤day2: first RRT within 2 days of hospital admission; CRRT: continuous renal replacement therapy; SLED: sustained low efficiency dialysis; iHD: intermittent haemodialysis; logUO: logarithm of urine volume; GCS: Glasgow coma scale; PreDiaBW: body weight before first dialysis; BT: body temperature; HR: heart rate; MAP: mean arterial pressure; logPFR: logarithm of the PaO2 to fraction of inspired oxygen ratio; BUN: blood urea nitrogen; Cre: serum creatinine; Na: sodium; K: potassium; WBC: white blood cells; Hb: haemoglobin; Plt: platelet count; HCO3: bicarbonate; IE: inotropic equivalent; APACH: Acute Physiology and Chronic Health Evaluation II score; SOFA: sequential organ failure assessment score.
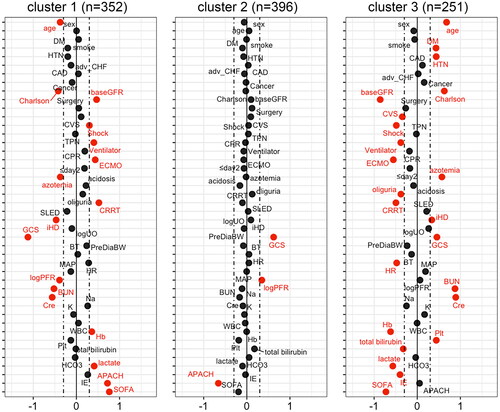
Figure 3. Associations of baseline eGFR and SOFA score upon RRT initialization with the three clusters of patients. The scatter plot illustrates each patient’s baseline eGFR and SOFA score upon RRT initialization, coloured by the three clusters. The red vertical line represents eGFR of 45 mL/min/1.73m2; the black horizontal line represents SOFA score of 13. eGFR: baseline estimated glomerular filtration rate; SOFA: sequential organ failure assessment; RRT: renal replacement therapy.
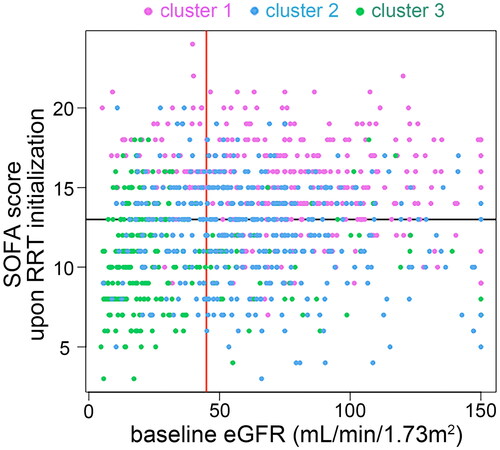
Figure 4. Clinical outcomes across the three clusters of patients. (A) Kaplan–Meier curves depict the survival probability of patients by the three clusters. (B) Cumulative incidence of being free of dialysis stratified by the three clusters with death as the competing risk. RRT: renal replacement therapy.
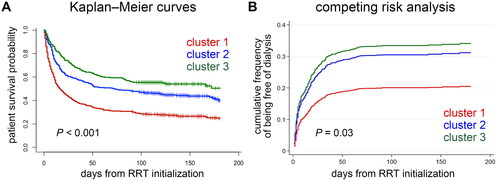
Figure 5. Supplementary unsupervised clustering of patients with dialysis-requiring sepsis-associated acute kidney injury. (A) This clustering approach was performed by principal component analysis of the 23 clinical parameters using the k-nearest neighbour graph structure embedding and Louvain community algorithm. Two clusters (591 patients in cluster A, 408 patients in cluster B) were identified and visualized by the Uniform Manifold Approximation and Projection (UMAP) dimensional reduction. (B-F) Violin plots showed the different features between the two clusters. ****p < 0.0001. (G) Feature plot projected on the UMAP depicts the serum lactate levels upon initializing renal replacement therapy. (H) Kaplan–Meier curves of patient survival stratified by the two clusters. Charlson: Charlson Comorbidity Index; eGFR: estimated glomerular filtration rate; BUN: blood urea nitrogen; logUO: logarithm of urine volume; GCS: Glasgow Coma Scale; BT: body temperature; MAP: mean arterial pressure; logPFR: logarithm of the PaO2 to fraction of inspired oxygen ratio; IE: inotropic equivalent; APACH: Acute Physiology and Chronic Health Evaluation II score; SOFA: sequential organ failure assessment score; RRT: renal replacement therapy.
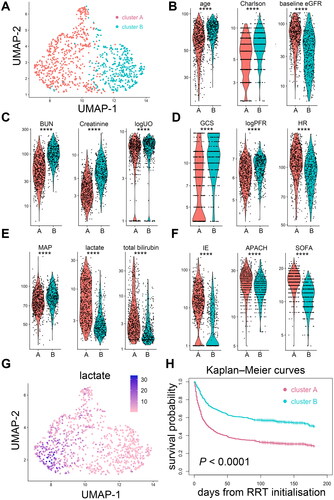
Table 2. Clinical model for identifying high-risk sub-phenotype 1.
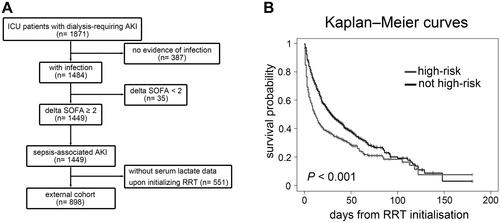
Figure 6. NEP-AKI-D cohort. (A) Among the 1871 patients with dialysis-requiring AKI and hospitalized in ICU between 2014 and 2016, 898 patients with dialysis-requiring sepsis-associated AKI were analyzed as the external cohort. (B) By applying the clinical model derived from the main study cohort, 319 patients in the external cohort were categorized as high-risk sub-phenotype. Kaplan–Meier curves showed that patients classified as having a high-risk sub-phenotype had higher in-hospital mortality compared to other patients. NEP-AKI-D: nationwide epidemiology and prognosis of dialysis-requiring acute kidney injury study; AKI: acute kidney injury; ICU: intensive care unit; SOFA: sequential organ failure assessment; RRT: renal replacement therapy.
Supplemental Material
Download MS Word (11.2 MB)Data availability statement
The data that support the findings of this study are available from the corresponding author (Prof. Vin-Cent Wu, e-mail [email protected]) on reasonable request.