
Figures & data
Table 1. Baseline characteristics of all the analysed cohorts.
Figure 1. Forest plot of the odds ratio of metabolic syndrome and body mass index in urologic diseases.
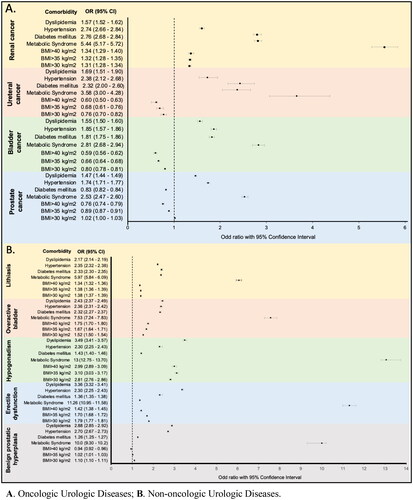
Table 2. Measures of association of common urologic diseases with different obesity BMI-thresholds.
Table 3. Measures of association between metabolic syndrome and no metabolic syndrome.
Table 4. Measure of association between metabolic syndrome components and urology diseases.
Data availability statement
The data that support the findings of this study are available from TriNetX, LLC. Restrictions apply to the availability of these data, which were used under licence for this study. Data are available at https://trinetx.com/products/real-world-datasets/ with the permission of TriNetX, LLC.