
Figures & data
Figure 1. Characterization of amyloid aggregates by AFM. The aggregates of different amyloid proteins deposited on mica surfaces were characterised by AFM. Representative images in false colours of (A,B) Aβ1-40, (C,D) TTR S52P, (E,F), D76N B2M and (G,H) ΔN6 B2M are shown (see the lateral vertical scale of the different heights measured with respect to the mica surface). Images were obtained before (A,C,E,G) or after adding (B,D,F,H) Amyposomes. All the images are obtained according to the procedure described in Material and Methods.
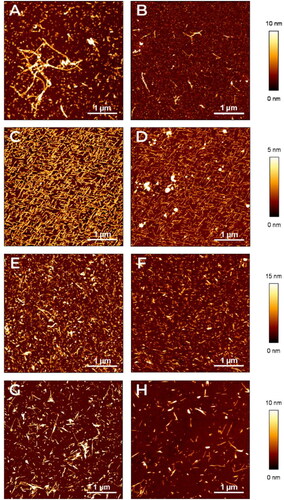
Figure 2. Amyposomes effect on Aβ1-40 aggregation and disaggregation. The effect of Amyposomes on Aβ1-40 aggregation and disaggregation at a different peptide:lipids (M:M) ratios was investigated by measuring the ThT fluorescence intensity. (A) Time course of ThT fluorescence starting from the non aggregated form of Aβ1-40. Data are expressed as the mean ± SD of triplicates and analyzed by two-ANOVA (F = 81.72 p < .0001). (B) Time course of ThT fluorescence starting from Aβ1-40 aggregates. Data are expressed as the mean ± SD of triplicates and analyzed by two-ANOVA (F = 39.71 p <.0001). AMYPO: amyposomes; PLAIN: liposomes composed of SM/Chol (1:1, molar ratio) used as a control.
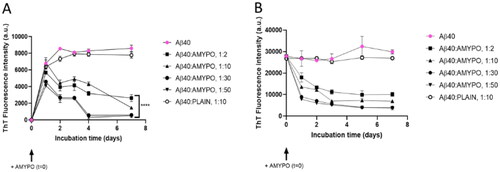
Figure 3. Amyposomes effect on TTR S52P aggregation and disaggregation. The effect of Amyposomes on TTR S52P aggregation and disaggregation at a different peptide:lipids (M:M) ratios was investigated by measuring the ThT fluorescence intensity. (A) Time course of ThT fluorescence starting from the non-aggregated form of TTR S52P. Data are expressed as the mean ± SD of triplicates and analyzed by two-ANOVA (F = 4.47 p < .021). (B) Time course of ThT fluorescence starting from TTR S52P aggregates. Data are expressed as the mean ± SD of triplicates and analyzed by two-ANOVA (F = 7.94 p < .0001). AMYPO: amyposomes; PLAIN: liposomes composed of SM/Chol (1:1, molar ratio) used as a control.
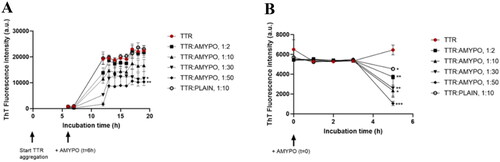
Figure 4. Amyposomes effect on β2microglobulin aggregation and disaggregation. The effect of Amyposomes on D76N and ΔN6 proteins aggregation and disaggregation at a different peptide:lipids (M:M) ratios was investigated by ThT fluorescence intensity. (A) Time course of ThT fluorescence starting from the non-aggregated form of D76N. Data are expressed as the mean ± SD of triplicates and analyzed by two-ANOVA (F = 207.6 p < .0001). (B) Time course of ThT fluorescence starting from D76N aggregates. Data are expressed as the mean ± SD of triplicates and analyzed by two-ANOVA (F = 50.19 p < .0001). (C) Time course of ThT fluorescence starting from the non-aggregated form of ΔN6. Data are expressed as the mean ± SD of triplicates and analyzed by two-ANOVA (F = 59.49 p < .0001). (D) Time course of ThT fluorescence starting from ΔN6 aggregates. Data are expressed as the mean ± SD of triplicates and analyzed by two-ANOVA (F = 9.10 p < .0001). AMYPO: amyposomes; PLAIN: liposomes composed of SM/Chol (1:1, molar ratio) used as a control.
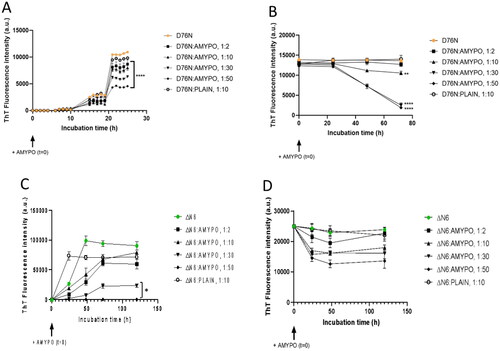
Figure 5. Amyposomes effect on SAA fragments aggregation and disaggregation. The effect of Amyposomes on SAA fragments aggregation and disaggregation at a different peptide:lipids (M:M) ratios was investigated by measuring the ThT fluorescence intensity. (A) Time course of ThT fluorescence starting from non-aggregated form of SAA1-76. Data are expressed as the mean ± SD of triplicates and analyzed by two-ANOVA (F = 705.3 p < .0001). (B) Time course of ThT fluorescence starting from SAA1-76 aggregates. Data are expressed as the mean ± SD of triplicates and analyzed by two-ANOVA (F = 34.88 p < .0001). AMYPO: amyposomes; PLAIN: liposomes composed of SM/Chol (1:1, molar ratio) used as a control.
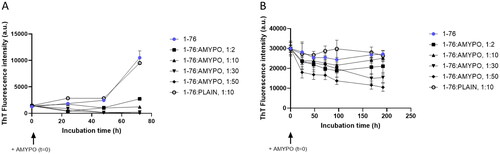
Figure 6. SPR sensorgrams showing the specific binding of different concentrations of Amyposomes (amyp) to the indicated immobilized protein aggregates. The Amyposomes concentrations, expressed as µM of the exposed PA, were 1.56, 3.125, 6.25 and 12.5 µM, and are indicated with increased thickness of the sensorgram. Amyposomes (amyp) flowed for three min as indicated. Black dashed lines shows the results of the global fitting of these sensorgrams (i.e. the four concentrations fitted together) according to the (A) Langmuir equation (1:1 interaction model) for Aβ1–40 and the heterogeneous ligand model for (B) TTR S52P, (C) β2m D76 and (D) β2m ΔN6. The parameters of the fittings are shown in the table below (ka1 and ka2: association rate constants; kd1 and kd2: dissociation rate constants; KD1 and KD2: equilibrium dissociation constants).
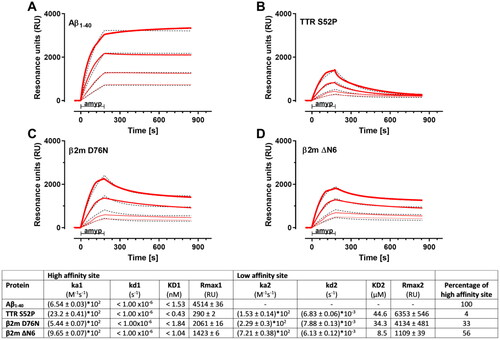
Figure 7. SPR sensorgrams showing the specific binding of Amyposomes to the immobilised protein aggregates (as indicated). Increasing concentrations of Amyposomes (1.56, 3.125, 6.25 and 12.5 µM of the exposed PA) were injected for three min (bars), in sequence, and are indicated in red with increased thickness of the sensorgram. Black dashed lines show the results of the global fitting of these sensorgrams (i.e. the five concentrations fitted together) according to the Langmuir equation (1:1 interaction model). For these fittings, Rmax (i.e. the maximum binding) was fixed for each protein to the corresponding immobilisation level, in order to take into account the differences on this parameter. The results of the fittings are shown. ka: association rate constant; kd: dissociation rate constant; KD: equilibrium dissociation constant.
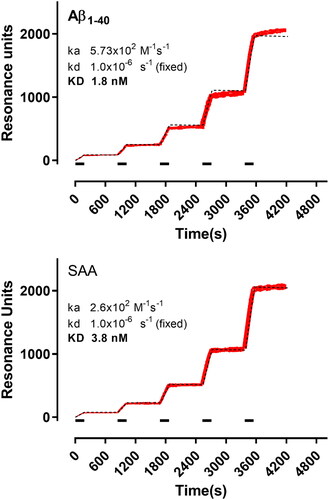
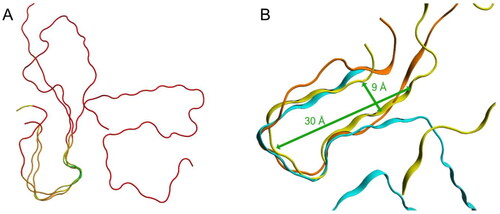
Figure 8. Structural superpositions of selected amyloid fibrils. (A) Structural superposition of TTR, SAA and Aβ1–4x, coloured according to their RMSD: in green the loop with associated the lowest RMSD value, in red the regions with associated the highest RMSD. 3D structures are represented as liquorice. (B) Structural superposition of TTR (light blue), SAA (yellow) and Aβ1–4x (orange). 3D structures are represented as ribbon.
Supplemental Material
Download MS Word (4.6 MB)Data availability statement
Data available within the article or its supplementary materials.