
Figures & data
Figure 1. Example of a 53-year-old male patient with bilateral chronic central serous chorioretinopathy (cCSC). (A–E) Multimodal imaging at baseline from the affected right eye. (A) Fundus photography showed serous detachment at macular area with diffuse atrophic RPE in the right eye. (B) Spectral domain optical coherence tomography (SD-OCT) scan at baseline from the right eye showing presence of subretinal fluid (SRF) with serous pigment epithelial detachment (PED, arrows). Presence of posterior cystoid retinal degeneration (arrowhead), pachychoroid with dilated vessels in haller’s layer (asterisks) can also be visible. (C–E) Early-, intermediate- and late-phase images from fluorescein angiography (FA, left panel) and indocyanine green angiography (ICGA, right panel). (C,D) Diffuse hyperfluorescent areas due to increased transmission of the choroidal fluorescence as well as hyperfluorescent areas due to window defects, staining and accumulation were visible in the early and intermediate phase of FA. (E) Maintenance of hyperfluorescence in areas of dye staining and pooling was visible in the late phase of FA. In the early phase of ICGA, dilated choroidal vessels can be observed (arrow). In the mid-phase of ICGA, geographic areas of hyperfluorescence with blurred contours due to choroidal vascular hyperpermeability was visible, areas of RPE atrophy appeared hypofluorescent (D). Such mid-phase hyperfluorescent areas was washed-out, forming a hyporfluorescent with a blurred hyperfluorescent rings (E). (F–J) Multimodal imaging at baseline from the left eye affected by secondary choroidal neovascularization (CNV). (F) Fundus photography showed serous sub-macular detachment with pigmentary abnormalities in the left eye. (G) SD-OCT B-scan centred to the fovea showing the flat irregular PED with sub-RPE hyperreflectivity (double layer sign). (H–J) Early-, intermediate- and late-phase images from FA (left panel) and ICGA (right panel) showed hyperfuorescence at macula.
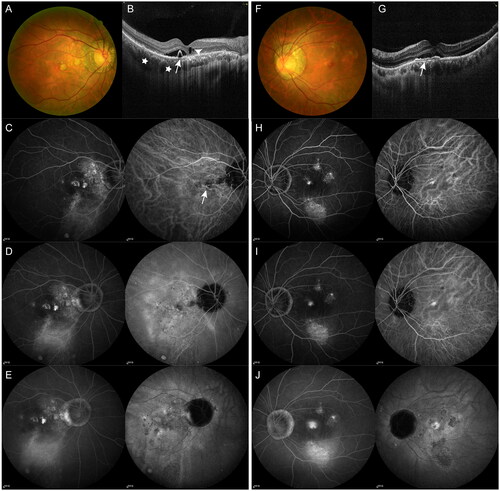
Table 1. Baseline demographics characteristics of patients that underwent intravitreal injection of aflibercept or subthreshold micropulse laser for chronic central serous chorioretinopathy.
Table 2. OCT characteristics of eyes that underwent intravitreal injection of aflibercept or subthreshold micropulse laser for chronic central serous chorioretinopathy at baseline and one-month follow-up visit.
Figure 2. Examples of the change in serous subretinal fluid (SRF) with spectral domain optical coherence tomography (SD-OCT) in patients with chronic central serous chorioretinopathy (cCSC) after intravitreal injections with aflibercept (IVA). The left panel represents SD-OCT B-scan images at baseline visit, the right panel represents SD-OCT B-scan images at one-month follow-up visit after IVA. (A) SD-OCT B-scan at baseline showed sub-macular SRF and irregularly appeared RPE from the right eye of a 65-year-old male patient (left). Hyperreflective foci (HFs) are visible between the ellipsoid zone and RPE (arrow). At the one-month visit after IVA treatment, SRF were resolved, however, disruptions in the ellipsoid zone remained (right). (B) SD-OCT B-scan at baseline showed sub-macular SRF from the right eye of a 49-year-old male patient (left). At the one-month visit after IVA treatment, SRF were completely resolved, the ellipsoid zone and RPE are intact (right). (C) SD-OCT B-scan at baseline showed presence of SRF and irregularly appeared RPE from the right eye of a 56-year-old male patient (left). The HFs are visible between the ellipsoid zone and RPE (arrow). At the one-month visit after IVA treatment, SRF were partially resolved. The presence of HFs remained, with disruptions in the ellipsoid zone and irregularly thickened RPE (right).
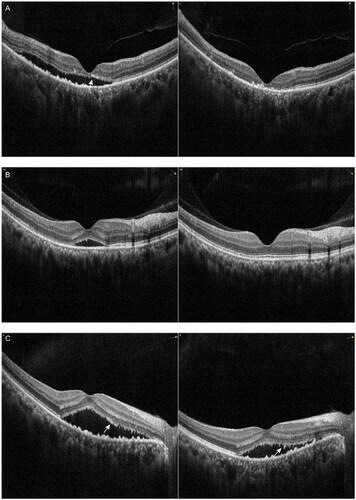
Figure 3. Examples of the change in pigment epithelial detachment (PED) with spectral domain optical coherence tomography (SD-OCT) in patients with chronic central serous chorioretinopathy (cCSC) after intravitreal injections with aflibercept (IVA). The left panel represents SD-OCT B-scan images at baseline visit, the right panel represents SD-OCT B-scan images at one-month follow-up visit after IVA. (A) SD-OCT scan at baseline from the right eye of the patient depicted in (left). At the one-month visit after IVA treatment, subretinal fluid (SRF) was completely absorbed, small PED in the temporal macula was resolved. The large dome-shaped PED height remained relatively stable and small posterior cystoid retinal degeneration and dilated choroidal vessels were visible (right). (B) SD-OCT B-scan at baseline showed sub-macular SRF and a small PED from the right eye of a 31-year-old female patient (left). Presence of RPE micro-rip at the peak of PED was visible (arrow). At the one-month visit, SRF as well as PED were resolved, undulating RPE was visible subfoveally (right). (C) SD-OCT B-scan at baseline showed sub-macular SRF and a small PED from the right eye of a 44-year-old male patient (left). At the one-month visit (right), SRF was partially absorbed, small PED was resolved, a discontinuous RPE was visible, likely representing the leakage spot in RPE (arrow).
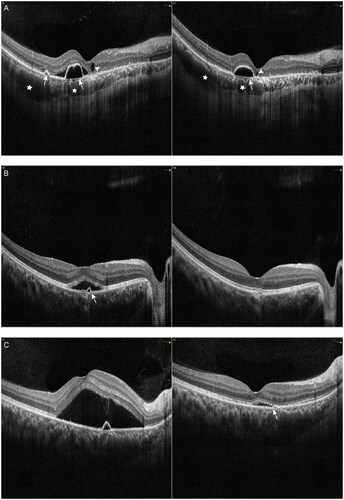
Figure 4. Examples of the change in serous subretinal fluid (SRF) with spectral domain optical coherence tomography (SD-OCT) in patients with chronic central serous chorioretinopathy (cCSC) after subthreshold micropulse laser (SML). The left panel represents SD-OCT B-scan images at baseline visit, the right panel represents SD-OCT B-scan images at one-month follow-up visit after SML. (A) SD-OCT B-scan at baseline showed sub-macular SRF from the left eye of a 39-year-old male patient (left). At the one-month visit after SML treatment, SRF were completely resolved, the ellipsoid zone and RPE were intact (right). (B) SD-OCT B-scan at baseline showed sub-macular SRF from the left eye of a 43-year-old male patient (left). At the one-month visit, SRF were completely resolved, however, disruptions in the ellipsoid zone can be visible (arrow) (right). (C) SD-OCT B-scan at baseline showed presence of SRF and irregularly appeared RPE from the left eye of a 52-year-old male patient (left). The HFs were visible between the ellipsoid zone and RPE. Small irregular PED was visible (arrowhead). At the one-month visit, SRF were resolved, however, discontinuous ellipsoid zone was visible (arrow), the disruptions in RPE remained visible (arrowhead) (right).
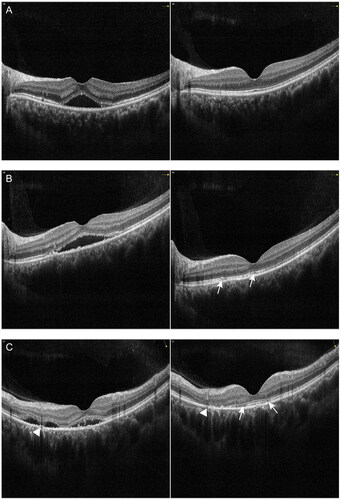
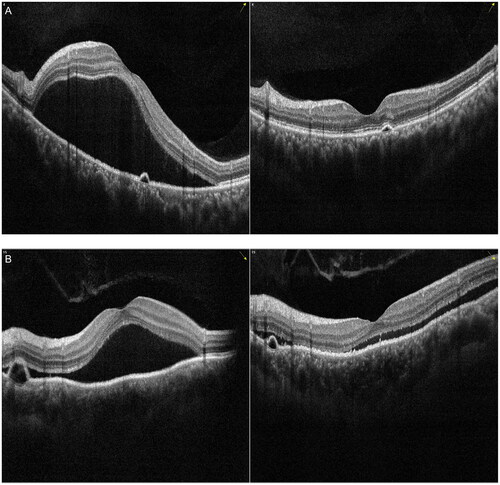
Figure 5. Examples of the change in pigment epithelial detachment (PED) with spectral domain optical coherence tomography (SD-OCT) in patients with chronic central serous chorioretinopathy (cCSC) after subthreshold micropulse laser (SML). The left panel represents SD-OCT B-scan images at baseline visit, the right panel represents SD-OCT B-scan images at one-month follow-up visit after SML. (A) SD-OCT B-scan at baseline showed sub-macular SRF and a small PED from the left eye of a 41-year-old male patient (left). SRF was completely absorbed, small PED remained visible with a discontinuous ellipsoid zone at one-month visit (right). (B) SD-OCT B-scan at baseline showed sub-macular SRF and a dome-shaped PED from the left eye of a 48-year-old female patient (left). At the one-month visit, SRF as well as PED were partially resolved (right).
Data availability statement
The data supporting the findings of this study are available from the corresponding author, YS, upon reasonable request.