
Figures & data
Figure 1. Preferred reporting items for systematic reviews and meta-analyses (PRISMA) flowchart for study identification and selection. The original database search resulted in 203 studies from four databases, including PubMed, ScienceDirect, EBSCO, and Taylor & Francis. Through title and abstract screening, 154 articles were removed and 49 articles were screened for duplication. Duplicate screening resulted in seven removed articles. Forty-two articles were furthermore assessed for eligibility and 12 articles were removed due to irrelevant study design. This step resulted in 29 final studies included in the qualitative synthesis.
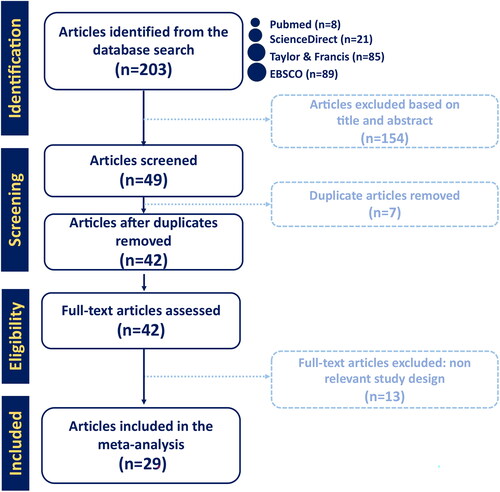
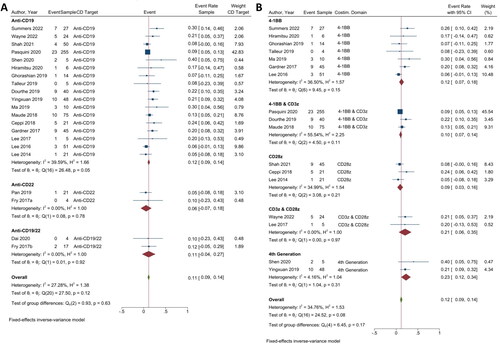
Figure 2. The minimum residual disease negative complete remission (MRD-CR) of CAR T-cell therapy. (A) Subgroup analysis of CD targets for MRD-CR. The analysis included data from 23 studies classified into three CD target subgroups, namely anti-CD19, anti-CD22 and anti-CD19/22. (B) Subgroup analysis of costimulatory domain target groups for MRD-CR. The analysis included data from 19 studies classified into five costimulatory subgroups, namely 4-1BB, 4-1BB & CD3ζ, CD28ζ, CD3ζ & CD28ζ and 4th generation. The y-axis indicates the median of the overall pooled estimate. The blue square and solid lines represent event rates with 95% confidence intervals. The size of the squares indicates the weight of each study. The red rhombus indicates the pooled estimate with 95% confidence intervals for each subgroup; meanwhile, the green rhombus indicates the overall pooled estimate.
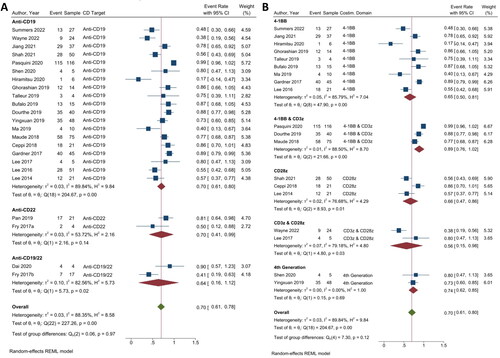
Figure 3. The relapse rate of CAR T-cell CD targets and the CD19 costimulatory domains. (A) Subgroup analysis of CD targets for relapse rate. The analysis included data from 17 studies classified into three CD target subgroups, namely anti-CD19, anti-CD22 and anti-CD19/22. (B) Subgroup analysis of costimulatory domain target groups for relapse rate. The analysis included data from 12 studies classified into five costimulatory subgroups, namely 4-1BB, 4-1BB & CD3ζ, CD28ζ, CD3ζ & CD28ζ, and 4th generation. The y-axis indicates the median of the overall pooled estimate. The blue square and solid lines represent event rates with 95% confidence intervals. The size of the squares indicates the weight of each study. The red rhombus indicates the pooled estimate with 95% confidence intervals for each subgroup; meanwhile, the green rhombus indicates the overall pooled estimate. (C) Subgroup analysis of the relapse rate of haplo-HSCT and CAR T-cell therapy. This analysis incorporated information from three studies focused on CAR T-cell therapy, with or without haplo-HSCT, and two studies examining haplo-HSCT, with or without CAR T-cell therapy. On the y-axis, the odd ratio is represented with a baseline value of 1.00. The blue square and solid lines represent event rates with 95% confidence intervals. The size of the squares indicates the weight of each study. The black rhombus indicates the pooled estimate with 95% confidence intervals for each subgroup.
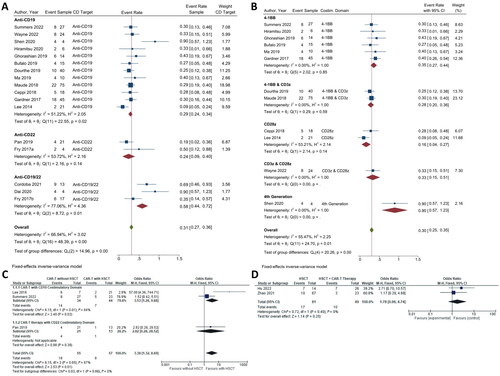
Figure 4. CAR T-cell safety. (A) Subgroup analysis of CD targets for CRS. The analysis included data from 23 studies classified into three CD target subgroups, namely anti-CD19, anti-CD22, and anti-CD19/22. (B) Subgroup analysis of costimulatory domain target groups for CRS. The analysis included data from 18 studies classified into five costimulatory subgroups, namely 4-1BB, 4-1BB & CD3ζ, CD28ζ, CD3ζ & CD28ζ and 4th generation. The y-axis indicates the median of the overall pooled estimate. The blue square and solid lines represent event rates with 95% confidence intervals. The size of the squares indicates the weight of each study. The red rhombus indicates the pooled estimate with 95% confidence intervals for each subgroup; meanwhile, the green rhombus indicates the overall pooled estimate.
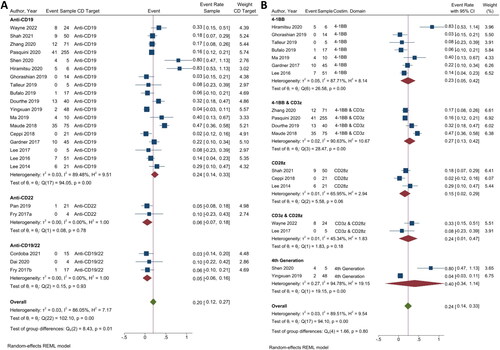
Figure 5. Immune effector cell-associated neurotoxicity syndrome in CAR T-cell therapy. (A) Subgroup analysis of CD targets for ICANS. The analysis included data from 21 studies classified into three CD target subgroups, namely anti-CD19, anti-CD22, and anti-CD19/22. (B) Subgroup analysis of costimulatory domain target groups for ICANS. The analysis included data from 17 studies classified into five costimulatory subgroups, namely 4-1BB, 4-1BB & CD3ζ, CD28ζ, CD3ζ & CD28ζ, and 4th generation. The y-axis indicates the median of the overall pooled estimate. The blue square and solid lines represent event rates with 95% confidence intervals. The size of the squares indicates the weight of each study. The red rhombus indicates the pooled estimate with 95% confidence intervals for each subgroup; meanwhile, the green rhombus indicates the overall pooled estimate.
Supplemental Material
Download MS Word (54.7 KB)Data availability
Data available within the article or its Supplementary Materials.