
Figures & data
Figure 1. Typical workflow for ddPCR in cancer liquid biopsies (Adapted from Ugur Gezer et al.) [Citation22].
![Figure 1. Typical workflow for ddPCR in cancer liquid biopsies (Adapted from Ugur Gezer et al.) [Citation22].](/cms/asset/ed8e71fc-5a2d-401e-8ac6-a2b6c385c9fe/iann_a_2353893_f0001_c.jpg)
Figure 2. Real-time PCR-based with regard quantifying (Adapted from Bernard PS et al.) [Citation15].
![Figure 2. Real-time PCR-based with regard quantifying (Adapted from Bernard PS et al.) [Citation15].](/cms/asset/c307f717-6bbe-4921-a620-02cbb38b0e33/iann_a_2353893_f0002_b.jpg)
Figure 3. RT-PCR (Adapted from Skondra M et al.) [Citation25].
![Figure 3. RT-PCR (Adapted from Skondra M et al.) [Citation25].](/cms/asset/46c00a8e-8f5c-48ba-90be-e31de2632a3e/iann_a_2353893_f0003_b.jpg)
Figure 4. Maxam-Gilbert DNA sequencing method (Adapted from Thermo Fisher Scientific: DNA Sequencing Technologies–History and Overview) [Citation30].
![Figure 4. Maxam-Gilbert DNA sequencing method (Adapted from Thermo Fisher Scientific: DNA Sequencing Technologies–History and Overview) [Citation30].](/cms/asset/b7f3d135-225b-4d83-8986-9e81f64ffe82/iann_a_2353893_f0004_c.jpg)
Figure 5. Sanger DNA sequencing method (Adapted from Thermo Fisher Scientific: DNA Sequencing Technologies–History and Overview) [Citation30].
![Figure 5. Sanger DNA sequencing method (Adapted from Thermo Fisher Scientific: DNA Sequencing Technologies–History and Overview) [Citation30].](/cms/asset/62e960fa-8ccf-449c-b652-6dfc13d7e7f2/iann_a_2353893_f0005_c.jpg)
Figure 6. Capillary electrophoresis (Adapted from Thermo Fisher Scientific: DNA Sequencing Technologies–History and Overview) [Citation30].
![Figure 6. Capillary electrophoresis (Adapted from Thermo Fisher Scientific: DNA Sequencing Technologies–History and Overview) [Citation30].](/cms/asset/cb53dc25-ef0e-4890-b3c0-ac64f020c2fc/iann_a_2353893_f0006_c.jpg)
Figure 7. (A) Technology for Ion Torrent sequencing and (B) technology for Illumina sequencing (Adapted from Thermo Fisher Scientific: DNA Sequencing Technologies–History and Overview) [Citation30].
![Figure 7. (A) Technology for Ion Torrent sequencing and (B) technology for Illumina sequencing (Adapted from Thermo Fisher Scientific: DNA Sequencing Technologies–History and Overview) [Citation30].](/cms/asset/e8b90f55-4b41-48c4-886f-8b87cce4e0f4/iann_a_2353893_f0007_c.jpg)
Figure 8. (A) The technology of SMRT sequencing and (B) the technology of nanopore sequencing (Adapted from Thermo Fisher Scientific: DNA Sequencing Technologies–History and Overview) [Citation30].
![Figure 8. (A) The technology of SMRT sequencing and (B) the technology of nanopore sequencing (Adapted from Thermo Fisher Scientific: DNA Sequencing Technologies–History and Overview) [Citation30].](/cms/asset/0ab737da-71ac-4949-b59b-2690e5262253/iann_a_2353893_f0008_c.jpg)
Figure 9. Profiling protein expression using microfluidic western blotting in circulating tumour cells (Adapted from Sinkala E et al.) [Citation54].
![Figure 9. Profiling protein expression using microfluidic western blotting in circulating tumour cells (Adapted from Sinkala E et al.) [Citation54].](/cms/asset/bf7004ba-2d6c-47e6-af39-4bcceeb7ebff/iann_a_2353893_f0009_c.jpg)
Figure 10. FISH (Adapted from Shakoori AR) [Citation57].
![Figure 10. FISH (Adapted from Shakoori AR) [Citation57].](/cms/asset/1ad0584d-b56a-443a-aa0f-8c462d5f2dae/iann_a_2353893_f0010_c.jpg)
Figure 11. The CGH principle (Adapted from Weiss MM et al.) [Citation64].
![Figure 11. The CGH principle (Adapted from Weiss MM et al.) [Citation64].](/cms/asset/2713ffc7-0b98-42ea-94f5-0e46da01214f/iann_a_2353893_f0011_b.jpg)
Figure 12. CGH was used to analyze the diversity of tumors and the sorts of reports (1992–1998) (Adapted from Weiss MM et al.) [Citation64].
![Figure 12. CGH was used to analyze the diversity of tumors and the sorts of reports (1992–1998) (Adapted from Weiss MM et al.) [Citation64].](/cms/asset/8ff53e7e-a5c3-4345-9728-ebcb6ae98ebc/iann_a_2353893_f0012_b.jpg)
Figure 13. The process of SNPs-seq. (Adapted from Zhang P et al.) [Citation71].
![Figure 13. The process of SNPs-seq. (Adapted from Zhang P et al.) [Citation71].](/cms/asset/3ceb7a3e-0a66-40e9-a223-f0bee8641dcc/iann_a_2353893_f0013_c.jpg)
Figure 14. Workflow in proteomic studies in cervical cancer (Adapted from Ding Z et al.) [Citation72].
![Figure 14. Workflow in proteomic studies in cervical cancer (Adapted from Ding Z et al.) [Citation72].](/cms/asset/280c255f-abad-4e08-a494-71c6e71b772e/iann_a_2353893_f0014_c.jpg)
Table 1. Advantages, disadvantages and outcomes of molecular techniques in cancer genetics.
Figure 15. Overview of liquid breast cancer biopsy (Adapted from Hacking SM et al.) [Citation96].
![Figure 15. Overview of liquid breast cancer biopsy (Adapted from Hacking SM et al.) [Citation96].](/cms/asset/a333cf02-dcdc-4cdf-932b-be68c844670e/iann_a_2353893_f0015_c.jpg)
Figure 16. The chromatin immunoprecipitation (ChIP) assay (Adapted from Collas P et al.) [Citation82].
![Figure 16. The chromatin immunoprecipitation (ChIP) assay (Adapted from Collas P et al.) [Citation82].](/cms/asset/0935e8f8-dfbc-4ade-bfe7-9f50a0c5aadc/iann_a_2353893_f0016_c.jpg)
Figure 17. Genome sequencing and ‘a priori’ methods: contrast and use (Adapted from Buono G et al.) [Citation44].
![Figure 17. Genome sequencing and ‘a priori’ methods: contrast and use (Adapted from Buono G et al.) [Citation44].](/cms/asset/e0e2e720-c7ba-4428-b5e5-389bf9f82142/iann_a_2353893_f0017_c.jpg)
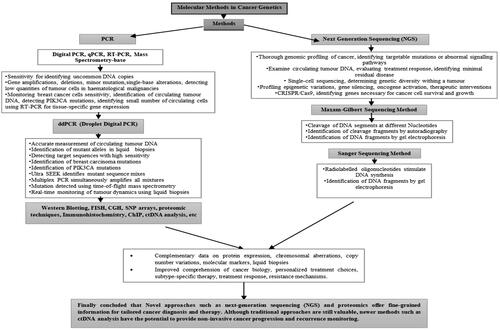
Figure 18. Flow chart representation of molecular methods in cancer diagnostics.
Data availability statement
Upon a reasonable request, the corresponding author [Dr. Jaishriram Rathored] will provide the data supporting the review’s conclusions.