Figures & data
Figure 1. The cAMP second messenger system. Chemical antidepressants upregulate 5‐HT and NE signaling to activate the cAMP signaling cascade. cAMP production results in the activation of CREB‐mediated gene transcription. PKA activates CREB both directly by phosphorylation and indirectly by triggering Ca2+ influx and the subsequent activation of CAMK and ERK. CREB triggers the expression of genes that promote cell proliferation, growth and resiliency, effects that could contribute to the ADT‐like effects observed in behavioral models. Molecules/proteins/genes altered in mood disorder patients or shown to regulate behavior in animal models of depression/ADT response are colored according to their associated effects (green = ADT, blue = prodepressive, yellow = antimanic, red = promanic, see online version for colour).
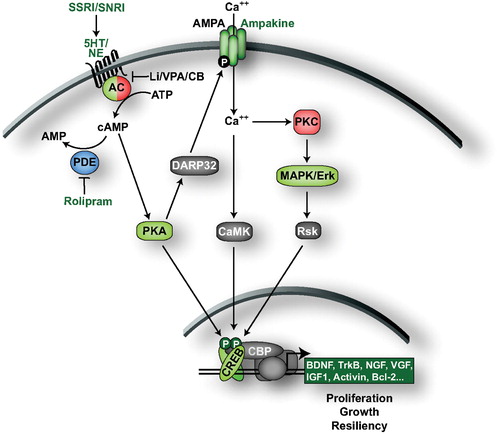
Figure 2. The ERK MAPK signaling pathway. Neurotrophic and growth factor receptors engage the RAF‐MEK‐ERK MAPK signaling cascade to regulate transcription factors including CREB. Activation of the ERK cascade by numerous neurotrophic/growth factors produces ADT effects in animal models. Increased Ca2+ levels triggered, for example by the glutamatergic system, also activate ERK signaling through PKC. The ERK‐CREB signaling pathway is downregulated by several phosphatases, including PP1, PP2A, DUSPs and STEP. CREB triggers the expression of genes that promote cell proliferation, growth, and resiliency, effects that could contribute to the ADT‐like effects observed in behavioral models. Molecules/proteins/genes altered in mood disorder patients or shown to regulate behavior in animal models of depression/ADT response are colored according to their associated effects (green = ADT, blue = prodepressive, yellow = antimanic, red = promanic, see online version for colour).
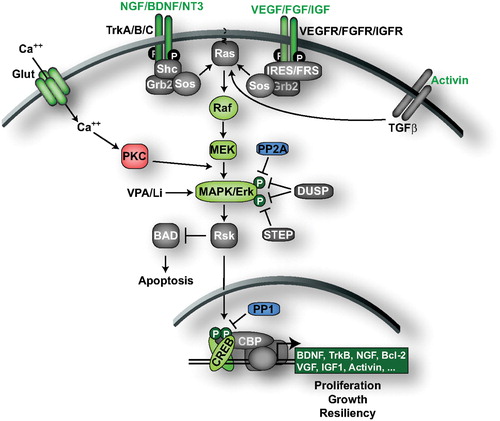
Figure 3. Phosphoinositol signaling and depletion by mood stabilizers. Following activation by growth factor and G‐protein‐coupled receptors, PLC catalyzes the production of IP3 and DAG to trigger release of Ca2+ from intracellular stores, and the activation of PKC to regulate neurotransmission, synaptic plasticity, and development. Mood stabilizers inhibit multiple aspects of this pathway, including influx of myoinositol through SMIT, recycling of IP3 into PIP2, and the activity of PKC. Molecules/proteins/genes altered in mood disorder patients or shown to regulate behavior in animal models of depression/ADT response are colored according to their associated effects (green = ADT, blue = prodepressive, yellow = antimanic, red = promanic, see online version for colour).
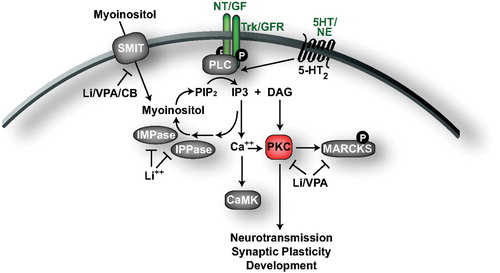
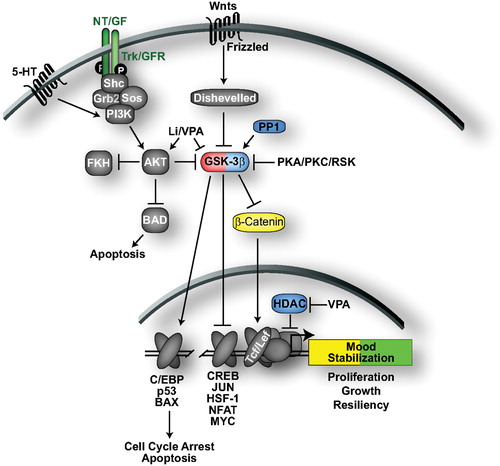
Figure 4. GSK‐3 signaling and mood stabilization. GSK‐3 regulates multiple transcription factors to trigger cell cycle arrest and apoptosis, while inhibiting the transcription of genes that promote cell proliferation, growth and resiliency. Wnt glycoproteins inhibit GSK‐3 activity through interactions with Disheveled while receptor tyrosine kinases and select G‐protein‐coupled receptors activate PI3K, which activates AKT to phosphorylate and inhibit GSK‐3. AKT also inhibits apoptosis through phosphorylation of Bad, a proapoptotic protein. Molecules/proteins/genes altered in mood disorder patients or shown to regulate behavior in animal models of depression/ADT response are colored according to their associated effects (green = ADT, blue = prodepressive, yellow = antimanic, red = promanic, see online version for colour).