
Figures & data
Table 1. Characterization of the sample.
Figure 1. Mean RR interval (MeanRR) of the patients in the control and hypertension groups. The symbols represent each subject from each group. • Control group and ▴Hypertension group.
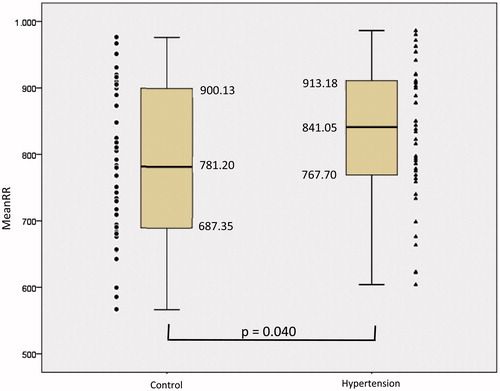
Figure 2. Standard deviation of the mean of all normal RR intervals (SDNN) of the patients in the control and hypertension groups. The symbols represent each subject from each group. • Control group and ▴Hypertension group.
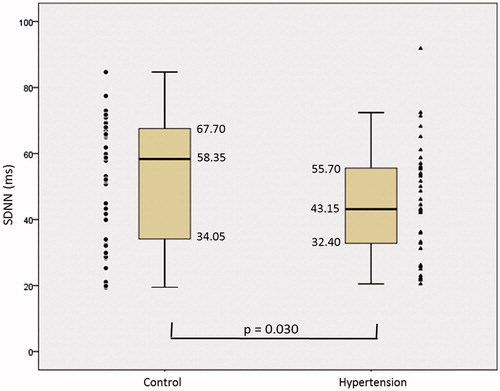
Table 2. Comparison of Heart Rate Variability parameters in the time domain between the control group and the hypertension group.
Figure 3. High frequency (HF), in control and hypertension groups. The symbols represent each subject from each group. • Control group and ▴Hypertension group.
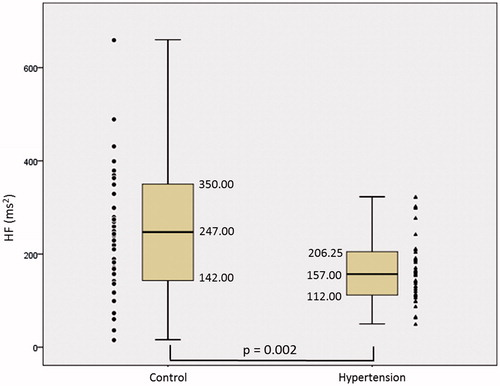
Table 3. Comparison of Heart Rate Variability parameters in the frequency domain between the control group and the hypertension group.
Figure 4. Ratio between SD1 and SD2 of the patients in the control and hypertension groups. The symbols represent each subject from each group. • Control group and ▴Hypertension group.
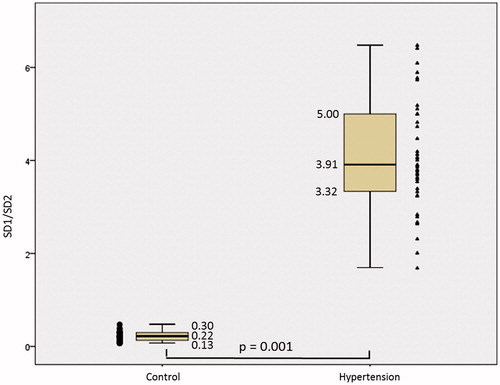
Table 4. Comparison of the geometric indices of Heart Rate Variability between the control group and the hypertension group.